Create a Multi-Cluster Monitoring Dashboard with Thanos, Grafana and Prometheus
Vikram Vaswani & Juan Ariza
Prometheus, coupled with Grafana, is a popular monitoring solution for Kubernetes clusters. It allows SRE teams and developers to capture metrics and telemetry data for applications running in a cluster, allowing deeper insights into application performance and reliability.
The Prometheus/Grafana combination works well for individual clusters, but as teams scale out and start working with multiple clusters, monitoring requirements become correspondingly more complex. For effective multi-cluster monitoring, a “single pane of glass” with centralized real-time monitoring, time series comparisons across and within clusters and high availability is essential for teams operating with multiple clusters and multiple providers.
Thanos is a monitoring system that aggregates data from multiple Prometheus deployments. This data can then be inspected and analyzed using Grafana, just as with regular Prometheus metrics. Although this setup sounds complex, it’s actually very easy to achieve with the following Bitnami Helm charts:
- Bitnami’s Prometheus Operator Helm chart lets you deploy Prometheus in your Kubernetes cluster with an additional Thanos sidecar container.
- Bitnami’s Thanos Helm chart lets you deploy all the Thanos components together with MinIO and Alertmanager so you can quickly bootstrap a Thanos deployment.
- Bitnami’s Grafana Helm chart lets you deploy Grafana in your Kubernetes cluster.
This guide walks you through the process of using these charts to create a Thanos deployment that aggregates data from Prometheus Operators in multiple clusters and allows further monitoring and analysis using Grafana.
Assumptions and prerequisites
-
You have three separate multi-node Kubernetes clusters running on the same cloud provider:
- Two “data producer” clusters which will host Prometheus deployments and applications that expose metrics via Prometheus.
- One “data aggregator” cluster which will host Thanos and aggregate the data from the data producers. This cluster will also host Grafana for data visualization and reporting.
-
You have the kubectl CLI and the Helm v3.x package manager installed and configured to work with your Kubernetes clusters. Learn how to install kubectl and Helm v3.x.
This guide uses clusters hosted on the Google Kubernetes Engine (GKE) service but you can use any Kubernetes provider. Learn about deploying a Kubernetes cluster on different cloud platforms.
Step 1: Install the Prometheus Operator on each cluster
Bitnami’s Prometheus Operator chart provides easy monitoring definitions for Kubernetes services and management of Prometheus instances. It also includes an optional Thanos sidecar container, which can be used by your Thanos deployment to access cluster metrics.
Only one instance of the Prometheus Operator component should be running in a cluster.
-
Add the Bitnami charts repository to Helm:
helm repo add bitnami https://charts.bitnami.com/bitnami -
Install the Prometheus Operator in the first “data producer” cluster using the command below:
helm install prometheus-operator \
  --set prometheus.thanos.create=true \
  --set operator.service.type=ClusterIP \
  --set prometheus.service.type=ClusterIP \
  --set alertmanager.service.type=ClusterIP \
  --set prometheus.thanos.service.type=LoadBalancer \
  --set prometheus.externalLabels.cluster="data-producer-0" \
  bitnami/prometheus-operator
The prometheus.thanos.create parameter creates a Thanos sidecar container, while the prometheus.thanos.service.type parameter makes the sidecar service available at a public load balancer IP address. Note the prometheus.externalLabels parameter which lets you define one or more unique labels per Prometheus instance - these labels are useful to differentiate different stores or data sources in Thanos.
The command above exposes the Thanos sidecar container in each cluster at a public IP address using a LoadBalancer service. This makes it easy for Thanos to access Prometheus metrics in different clusters without needing any special firewall or routing configuration. However, this approach is highly insecure and should be used only for demonstration or testing purposes. In production environments, it is preferable to deploy an NGINX Ingress Controller to control access from outside the cluster and further limit access using whitelisting and other security-related configuration.
-
Use the command below to obtain the public IP address of the sidecar service. You will use this IP address in the next step.
kubectl get svc | grep prometheus-operator-prometheus-thanos
Repeat the steps shown above for the second “data producer” cluster. Use a different value for the prometheus.externalLabels.cluster parameter, such as data-producer-1.
Step 2: Install and configure Thanos
The next step is to install Thanos in the “data aggregator” cluster and integrate it with Alertmanager and MinIO as the object store.
-
Modify your Kubernetes context to reflect the cluster on which you wish to install Thanos.
-
Create a values.yaml file as shown below. Replace the KEY placeholder with a hard-to-guess value and the SIDECAR-SERVICE-IP-ADDRESS-X placeholders with the public IP addresses of the Thanos sidecar containers in the “data producer” clusters.
objstoreConfig: |- type: s3 config: bucket: thanos endpoint: {{ include "thanos.minio.fullname" . }}.monitoring.svc.cluster.local:9000 access_key: minio secret_key: KEY insecure: true querier: stores: - SIDECAR-SERVICE-IP-ADDRESS-1:10901 - SIDECAR-SERVICE-IP-ADDRESS-2:10901 bucketweb: enabled: true compactor: enabled: true storegateway: enabled: true ruler: enabled: true alertmanagers: - http://prometheus-operator-alertmanager.monitoring.svc.cluster.local:9093 config: |- groups: - name: "metamonitoring" rules: - alert: "PrometheusDown" expr: absent(up{prometheus="monitoring/prometheus-operator"}) minio: enabled: true accessKey: password: "minio" secretKey: password: "KEY" defaultBuckets: "thanos" -
Install Thanos using the command below:
helm install thanos bitnami/thanos \ --values values.yaml -
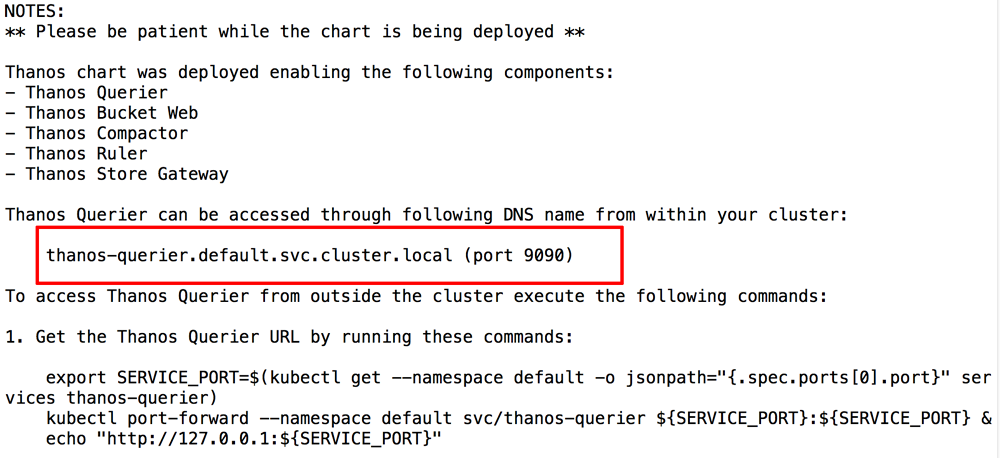
Wait for the deployment to complete and note the DNS name and port number for the Thanos Querier service in the deployment output, as shown below:
-
Follow the instructions shown in the chart output to connect to the Thanos Querier Web interface and navigate to the “Stores” tab. Confirm that both sidecar services are running and registered with Thanos, as shown below:
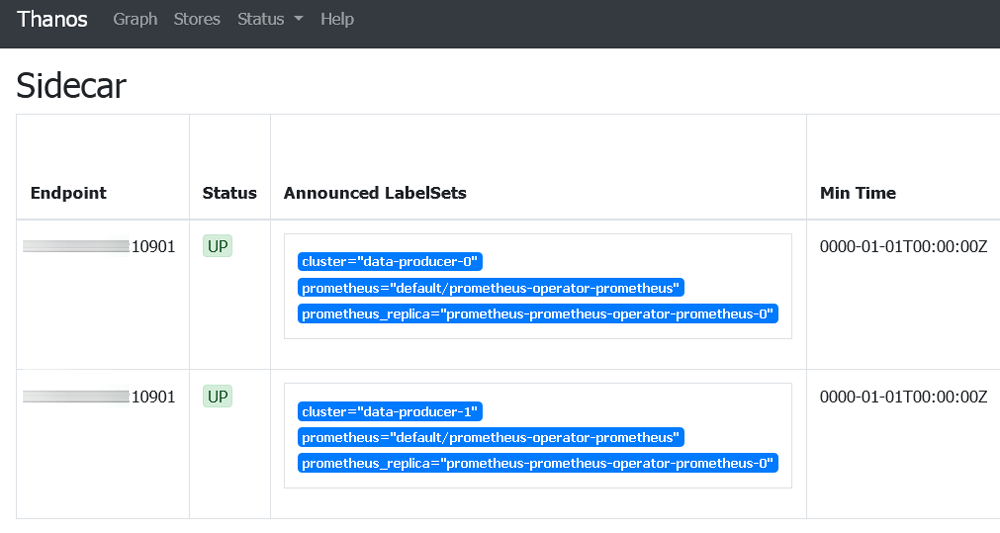
Confirm also that each service displays a unique cluster labelset, as configured in Step 1.
Step 3: Install Grafana
The next step is to install Grafana, also on the same “data aggregator” cluster as Thanos.
-
Use the command below, replacing GRAFANA-PASSWORD with a password for the Grafana application:
helm install grafana bitnami/grafana \ --set service.type=LoadBalancer \ --set admin.password=GRAFANA-PASSWORD -
Wait for the deployment to complete and obtain the public IP address for the Grafana load balancer service:
kubectl get svc | grep grafana -
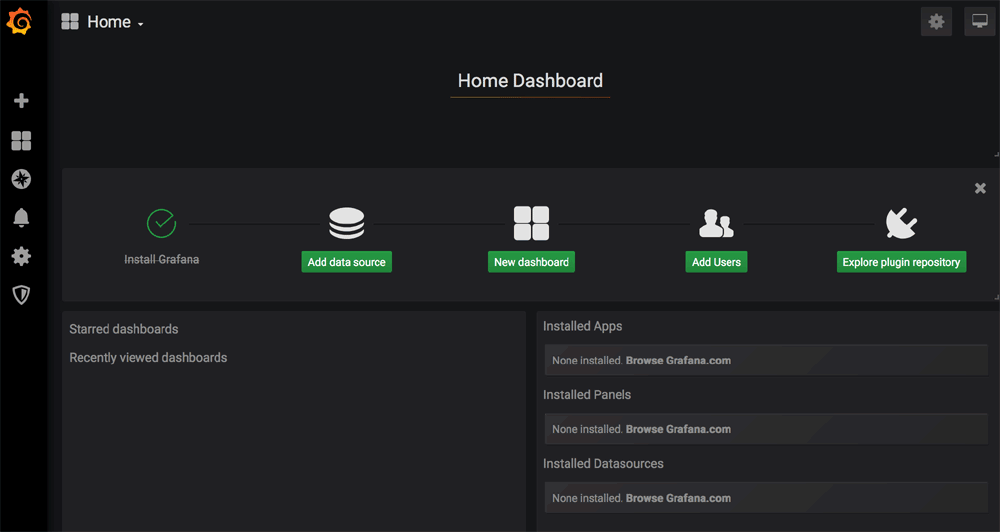
Confirm that you are able to access Grafana by browsing to the load balancer IP address on port 3000 and logging in with the username admin and the configured password. Here is what you should see:
Step 4: Configure Grafana to use Thanos as a data source
Follow these steps:
-
From the Grafana dashboard, click the “Add data source” button.
-
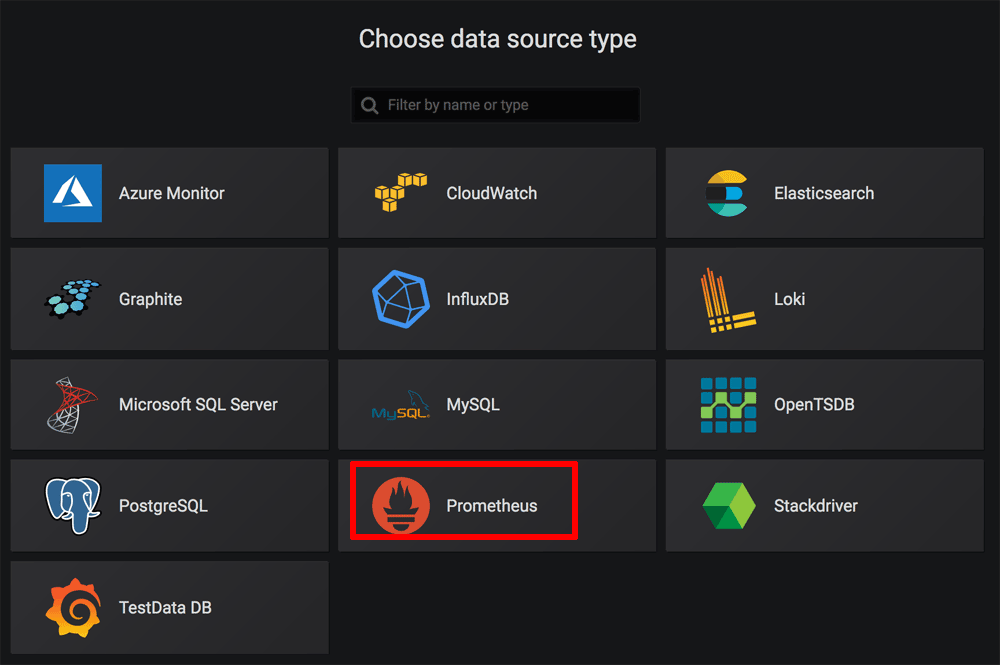
On the “Choose data source type” page, select “Prometheus”.
-
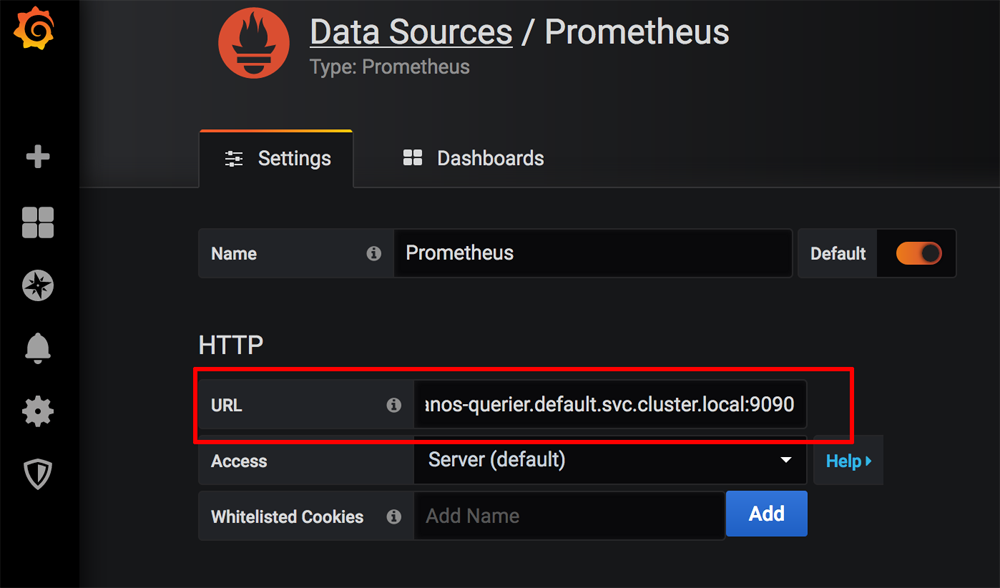
On the “Settings” page, set the URL for the Prometheus server to http://NAME:PORT, where NAME is the DNS name for the Thanos service obtained at the end of Step 2 and PORT is the corresponding service port. Leave all other values at their default.
-
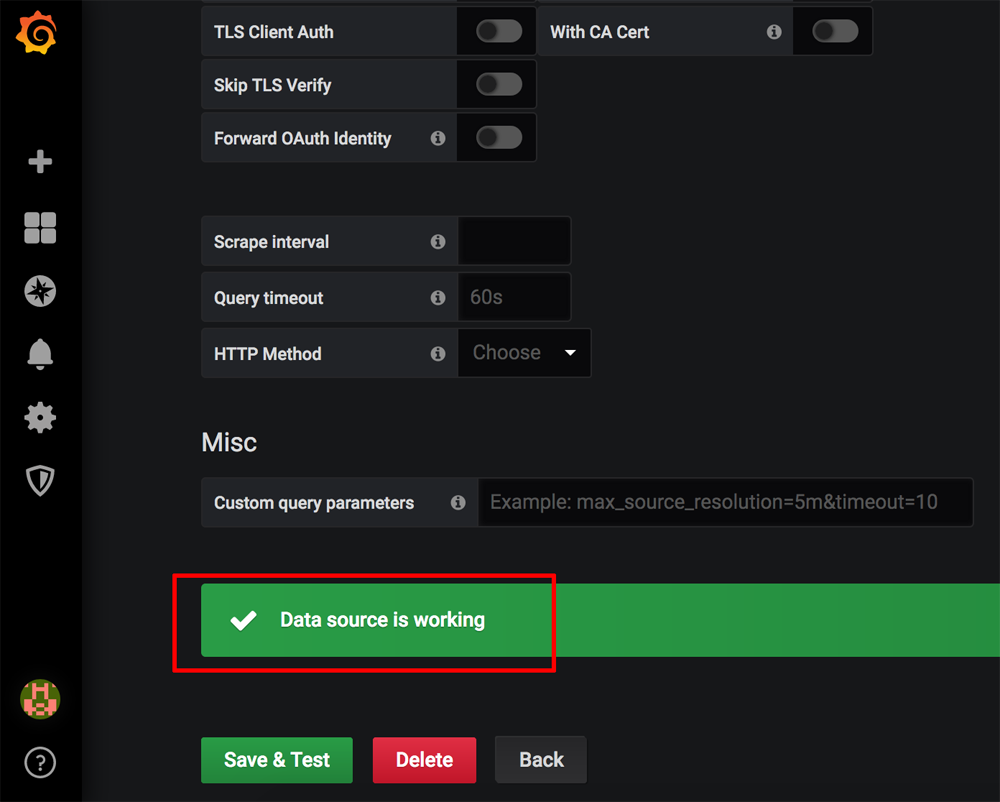
Click “Save & Test” to save and test the configuration. If everything is configured correctly, you should see a success message like the one below.
Step 5: Test the system
At this point, you can start deploying applications into your “data producer” clusters and collating the metrics in Thanos and Grafana. For demonstration purposes, this guide will deploy a MariaDB replication cluster using Bitnami’s MariaDB Helm chart in each “data producer” cluster and display the metrics generated by each MariaDB service in Grafana.
-
Deploy MariaDB in each cluster with one master and one slave using the production configuration with the commands below. Replace the MARIADB-ADMIN-PASSWORD and MARIADB-REPL-PASSWORD placeholders with the database administrator account and replication account password respectively. You can also optionally create a MariaDB user account for application use by specifying values for the USER-PASSWORD, USER-NAME and DB-NAME placeholders.
helm install mariadb \
  --set rootUser.password=MARIADB-ADMIN-PASSWORD \
  --set replication.password=MARIADB-REPL-PASSWORD \
  --set db.user=USER-NAME \
  --set db.password=USER-PASSWORD \
  --set db.name=DB-NAME \
  --set slave.replicas=1 \
  --set metrics.enabled=true \
  --set metrics.serviceMonitor.enabled=true \
  bitnami/mariadb
Note the metrics.enabled parameter, which enables the Prometheus exporter for MySQL server metrics, and the metrics.serviceMonitor.enabled parameter, which creates a Prometheus Operator ServiceMonitor.
-
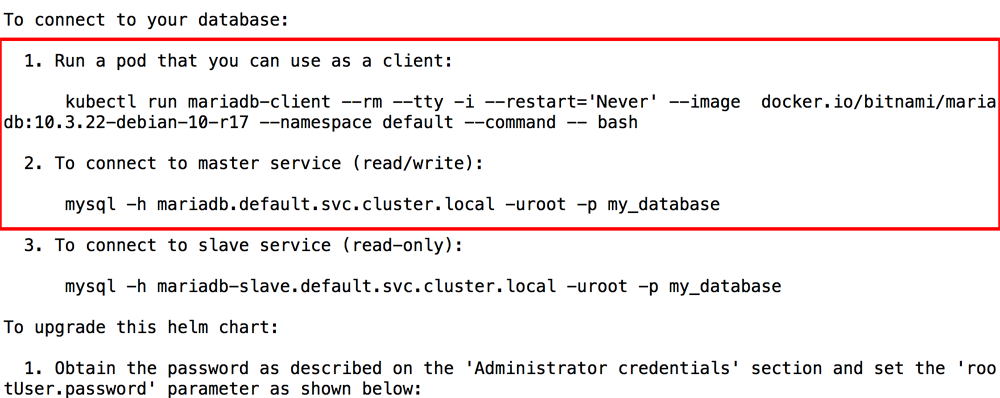
Once deployment in each cluster is complete, note the instructions to connect to each database service.
-
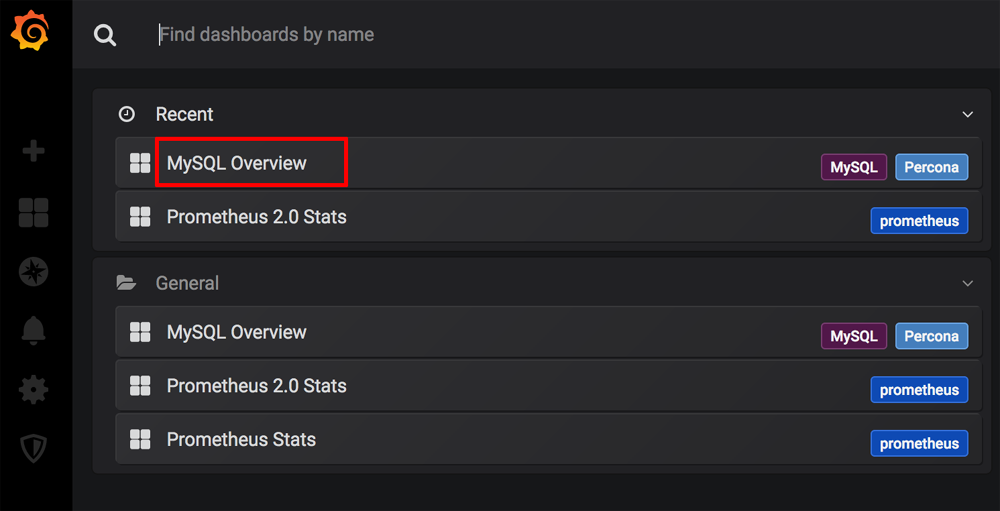
Browse to the MySQL Overview dashboard in the Percona GitHub repository and copy the JSON model.
-
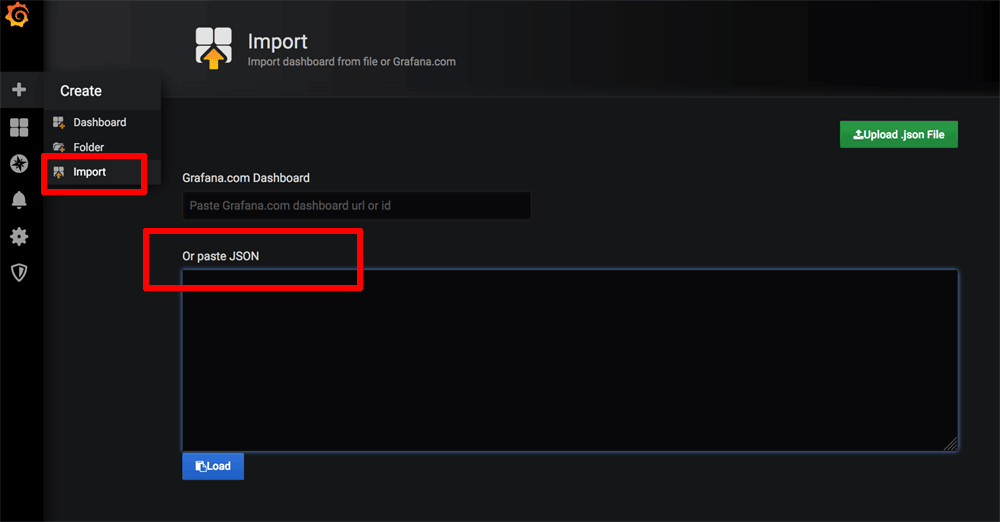
Log in to Grafana. From the Grafana dashboard, click the “Import -> Dashboard” menu item.
-
On the “Import” page, paste the JSON model into the “Or paste JSON” field.
-
Click “Load” to load the data and then “Import” to import the dashboard. The new dashboard should appear in Grafana, as shown below:
-
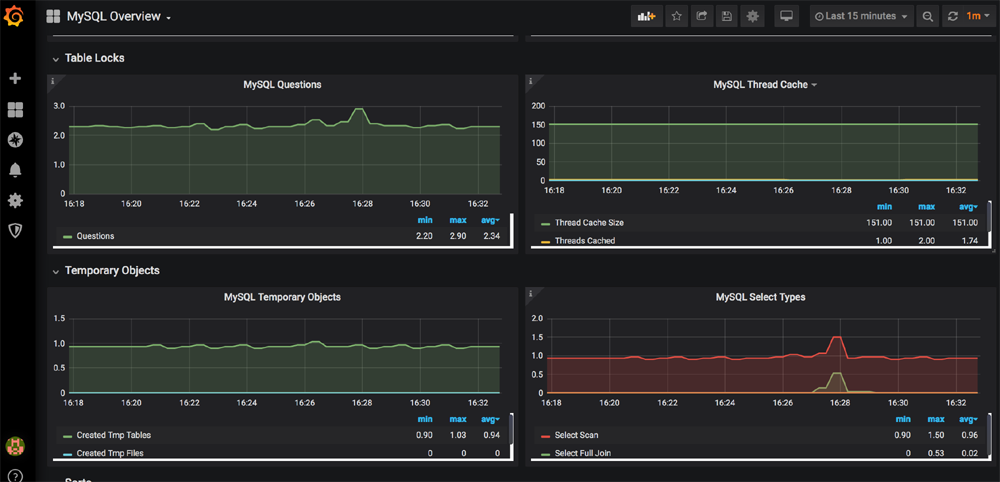
Connect to the MariaDB service in the first “data producer” cluster and perform some actions, such as creating a database, adding records to a table and executing a query. Perform similar actions in the second “data producer” cluster. You should see your activity in each cluster reflected in the MySQL Overview chart in Grafana, as shown below:
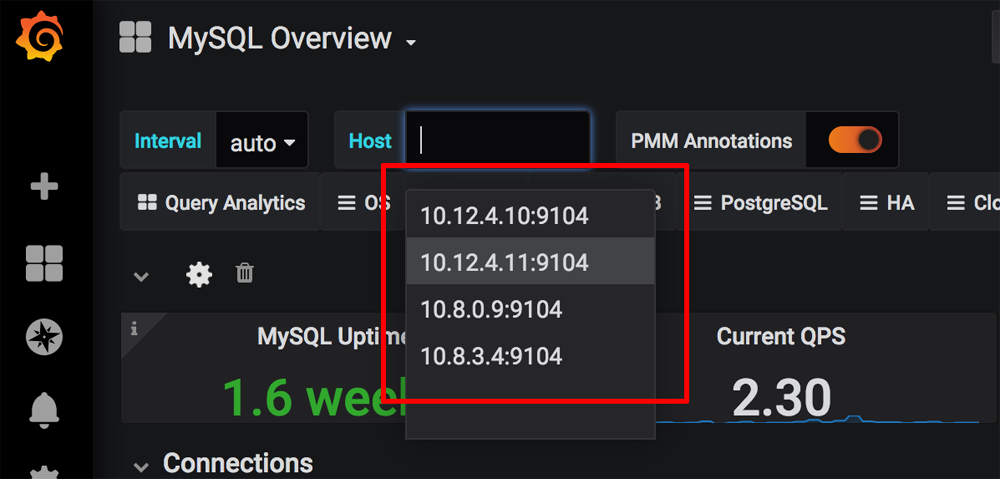
You can view metrics from individual master and slave nodes in each cluster by selecting a different host in the “Host” drop down of the dashboard, as shown below:
You can now continue adding more applications to your clusters. So long as you enable Prometheus metrics and a Prometheus Operator ServiceMonitor for each deployment, Thanos will continuously receive and aggregate the metrics and you can inspect them using Grafana.
Useful links
To learn more about the topics discussed in this guide, use the links below:
- Bitnami Prometheus Operator Helm chart
- Bitnami’s Thanos Helm chart
- Bitnami’s Grafana Helm chart
- Bitnami MariaDB Helm chart
- NGINX Ingress controller documentation
- Secure Kubernetes Services with Ingress, TLS and Let’s Encrypt