Showback Reference Architecture
This document discusses showback for Kubernetes clusters, such as those provided by Tanzu Kubernetes Grid (TKG). It covers concepts, and implementation considerations. This document represents how the VMware field team approaches showback in large enterprise Kubernetes environments.
At a high level, the key observations and recommendations are:
- Use resource requests to represent a tenant’s resource consumption
- Overlay resource usage and resource requests to find workloads that have requested too many resources
- Enforce a consistent label across workloads to map pods to tenants
- Persist showback metrics in long-term storage for reporting and analytics
Background
Showback and chargeback are IT practices implemented by an organization. The goal of these practices is to understand the allocation and costs associated with each department or division’s usage of IT systems. On the one hand, showback provides visibility into the allocation and costs of resources. Chargeback, on the other hand, builds on showback, in that it cross-charges the IT costs to each business unit. This document focuses on showback in the context of Kubernetes.
Kubernetes-based application platforms can host applications that belong to different business units or application teams. By implementing showback, the platform team gains visibility into how the cluster resources are allocated to the different platform tenants. With this information, platform teams can inform tenants about their resource allocations, increase infrastructure utilization, inform their capacity planning, and potentially reduce IT spend.
Resource requests versus usage
Kubernetes exposes different metrics that you can use to build a showback model. When considering showback, organizations sometimes jump to the conclusion that they should report exclusively on resource usage. However, resource usage is only half the picture. The other half, and the more important one, is resource requests.
When deploying applications to Kubernetes, developers request resources for their workloads. The scheduler uses the resource requests to assign the workload to a node on the cluster. Once scheduled, the cluster’s capacity is reduced by the workload’s requests. In other words, the resources requested by the workload are reserved for the workload. From the platform perspective, those resources are considered fully utilized, regardless of the workload’s actual resource consumption.
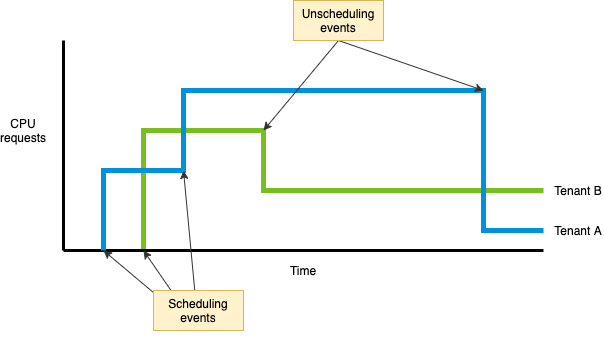
Reporting on resource requests enables platform operators to understand how tenants are sharing cluster resources. Consider the following diagram, which shows the CPU requests of two platform tenants over time. As the workloads of each tenant are scheduled and unscheduled, the CPU requests increase and decrease accordingly.
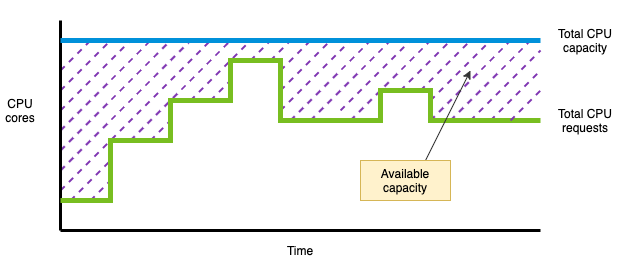
By aggregating the CPU requests of all tenants, platform operators can understand how the CPU capacity of the cluster is being used. The following diagram shows the aggregate CPU requests of all tenants and the cluster’s CPU capacity. The difference between the total CPU requests and the total CPU capacity is the available CPU capacity for additional workloads.
Building a showback system based on resource requests is a good foundation. As you can see from the previous diagrams, resource requests provide insight into how tenants are sharing the cluster resources. Furthermore, the aggregate of all resource requests can help platform operators with capacity planning.
Platform operators gain additional insight when they evaluate resource usage in addition to resource requests. By comparing usage versus requests, platform operators can derive cluster utilization. Furthermore, they can identify tenants that are wasting resources by not consuming their requests.
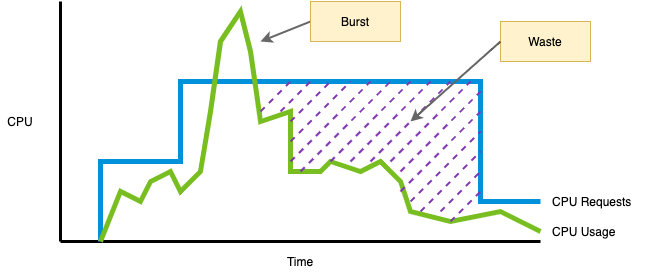
The following diagram shows the CPU usage and requests of a platform tenant over time. There are two important aspects to consider in this diagram. First, the tenant’s workload exceeded the resource requests. From a showback perspective, burst CPU usage can be regarded as a freebie. The second, more important thing to consider is the wasted CPU capacity. Based on the diagram, the tenant is requesting more CPU than necessary, thus wasting CPU capacity that could otherwise be used to schedule additional workloads on the cluster.
One of the most common causes of low utilization is the improper sizing of workloads. Showback reports that show both resource usage and requests help identify workloads that need adjustment. Platform operators can use these reports to ask tenants to adjust their requests to avoid wasting resources.
Implementing showback
The core of a showback system involves collecting metrics from the platform, storing them over time, and building tenant-specific reports or dashboards. Various monitoring tools can be used for showback, ranging from general-purpose monitoring systems such as Prometheus, to showback/chargeback specific tools such as CloudHealth.
Collecting metrics
Resource requests
The resource requests of a pod are specified in the pod object. Each container
in the pod declares the resource requests in the resources.requests field.
Because resource requests are part of the pod’s configuration, Kubernetes does
not expose this information via metrics.
To collect resource request metrics, you must install
kube-state-metrics in your
platform. kube-state-metrics is a service that queries the Kubernetes API and
exposes useful metrics about the API objects (Deployments, Pods, Nodes, etc.).
The CPU and memory requests for all pods on the cluster are available through
the kube_pod_container_resource_requests and
kube_pod_container_resource_requests_memory_bytes metrics. You can leverage
these metrics for the showback report.
Resource usage
Resource usage information for each pod is captured by the
Kubelet
and exposed through a Prometheus-compatible endpoint. As opposed to resource
requests, these metrics are readily available for consumption by your monitoring
stack. The CPU usage of a pod is available through the
container_cpu_usage_seconds_total metric, while the memory usage is available
through the container_memory_usage_bytes metric. You can use these metrics to
build the usage side of your showback reports.
Workload metadata
In addition to the resource requests and usage metrics, the showback system
captures workload metadata to map workloads to tenants. What metadata to capture
depends on the tenancy model of the cluster. If a tenant maps to a single
namespace, the workload’s namespace can be used to determine the workload’s
owner. This approach, however, results in strong coupling between the cluster
namespacing strategy and the showback strategy. An alternative, more flexible
approach is to determine the tenant based on a pod label, such as
cloud.example.com/owner. This method enables tenants to evolve and change
namespaces without affecting the showback implementation.
Metrics collection interval
The metrics collection interval determines how often the showback metrics are collected from the platform. This interval is important because it impacts the accuracy of the showback system. Short collection intervals produce more data and thus more accurate showback reports. However, short collection intervals also increase the performance burden on the cluster.
While finding the right collection interval requires iteration and experimentation, collecting metrics every minute is typically a good starting point.
Another consideration to make when it comes to the collection interval is the type of workloads running on the cluster. For example, short-lived ephemeral jobs most likely require shorter collection intervals than long-running services.
Metrics storage
Once the metrics are captured, they must be stored in a database for long-term storage and reporting. In the case of Prometheus, the metrics are stored in a time-series database that can then be queried for building dashboards and reports. Prometheus does not support clustering or replication of the data. Thus, high availability and long term storage of metrics are achieved through an additional system, such as Thanos.
Reports / Dashboards
The showback system produces reports based on the metrics collected from the cluster. The reports account for a given period, and they aggregate the metrics by tenant. Platform operators can send tenant-specific showback reports to each tenant on a schedule. Operators can also leverage interactive dashboards to show the data.
If using Prometheus, you can use Grafana to create dashboards that display the showback information according to your needs. SaaS-based showback implementations, such as CloudHealth, have pre-configured dashboards that you can leverage.
Extending to chargeback
This document focuses on showback and the considerations you need to make to implement a showback system. In some cases, organizations need to bill platform tenants for the resources used by their applications. This is achieved through a chargeback system.
You can build a chargeback system on top of showback by translating the resource allocations into dollar amounts that can be billed to the tenants. To perform the translation, you first have to assign dollar costs to each resource. For example, how much does one hour of CPU cost?
There are multiple factors to consider when establishing costs. If the cluster is running on the cloud, the cost of a node is easier to determine than if the cluster is on-premises (the cloud provider establishes node costs). At the same time, there are additional costs when running on the cloud that might not apply when running on-premises, such as network usage, load balancers, etc. Another factor to consider is whether the cluster has multiple node types with different costs. If so, the cost of a workload will depend on the node where it is running.
Establishing the cost model is perhaps the most challenging step to implement a chargeback system. Once you have assigned costs to each consumable resource, however, evolving a showback system into a chargeback system is straightforward. By grabbing the resource allocation of each tenant, and multiplying it by the resource costs, you obtain the dollar amounts that must be charged to each tenant.