Kubernetes Platform Monitoring
This document details platform monitoring and alerting for Kubernetes clusters, such as those provided by Tanzu Kubernetes Grid (TKG). It covers architectural considerations, best practices, and will provide guidance for offering alerting and monitoring to resident applications . This document represents how the VMware field team approaches monitoring in large enterprise Kubernetes environments.

Tooling
For new implementations of monitoring, it is suggested to run Prometheus inside of Kubernetes. The recommended approach is to utilize the existing kube-prometheus repository provided by CoreOS (Red Hat). This project allows an administrator to deploy and tune an end-to-end Prometheus solution within a Kubernetes cluster. It contains the following components:
- Prometheus operator
- Highly available
alert-manager - Prometheus node-exporter
- Prometheus Adapter for Kubernetes Metrics APIs
kube-state-metrics- Grafana
kube-state-metrics
kube-state-metrics is a first-party project of Kubernetes. Running as a DaemonSet on the Kubernetes cluster, this component generates metrics from API events that occur within Kubernetes. Its focus is on exposing events related to Kubernetes objects within the cluster in a raw and unmodified format.
Prometheus
Prometheus is a CNCF project widely used for Kubernetes platform monitoring as well as metrics collection and aggregation. Prometheus works by scraping data from configured endpoints, parsing it and storing it in its internal time-series database. This data can then be easily queried directly with PromQL, or displayed using a visualization tool such as Grafana.
Prometheus has push-gateway facility as well, for instrumenting applications with the available client libraries to push metrics when exposing an endpoint to scrape is not suitable. Ephemeral jobs such as pipelines are a good example of tasks in which pushing data to the metrics server make sense.
Prometheus node-exporter
node-exporter is a separate
binary in the Prometheus project. It exposes metrics for underlying container
platform, os, and hardware of each Kubernetes node to be consumed by Prometheus.
It can be configured with various collectors to determine what kind of system
data to be provided. The node-exporter is implemented as a DaemonSet running
as a service on each node in the Kubernetes cluster.
Prometheus Adapter for Kubernetes Metrics APIs
k8s-prometheus-adapter
is an agent that runs as an application Deployment in your cluster. It is an
implementation of the Kubernetes resource metrics API and custom metrics API
that acts downstream of Prometheus to provide feedback on applications using
metrics data. It implements HorizontalPodAutoscaler functionality that can
react and scale applications based on real-time metrics data.
Prometheus Alertmanager
alert-manager is the handler for alerts sent by the Prometheus server. Alertmanager handles integrating with external services by responding to metric-related events such as notifying email, PagerDuty, or OpsGenie. Alertmanager provides a CRD that can be tuned via replica-count and other parameters.
Grafana
Grafana is a second UI layer that is optional, however provides much more flexibility in visualizing metrics data through the creation of custom dashboards. Grafana is suggested for operational environments because of its rich set of RBAC, authentication, and customizable dashboards.
Installation & Configuration
In order to install platform monitoring, clone the kube-prometheus git repository and apply the manifests specified in the install guide:
# Create the namespace and CRDs, and then wait for them to be availble before creating the remaining resources
kubectl create -f manifests/setup
until kubectl get servicemonitors --all-namespaces ; do date; sleep 1; echo ""; done
kubectl create -f manifests/
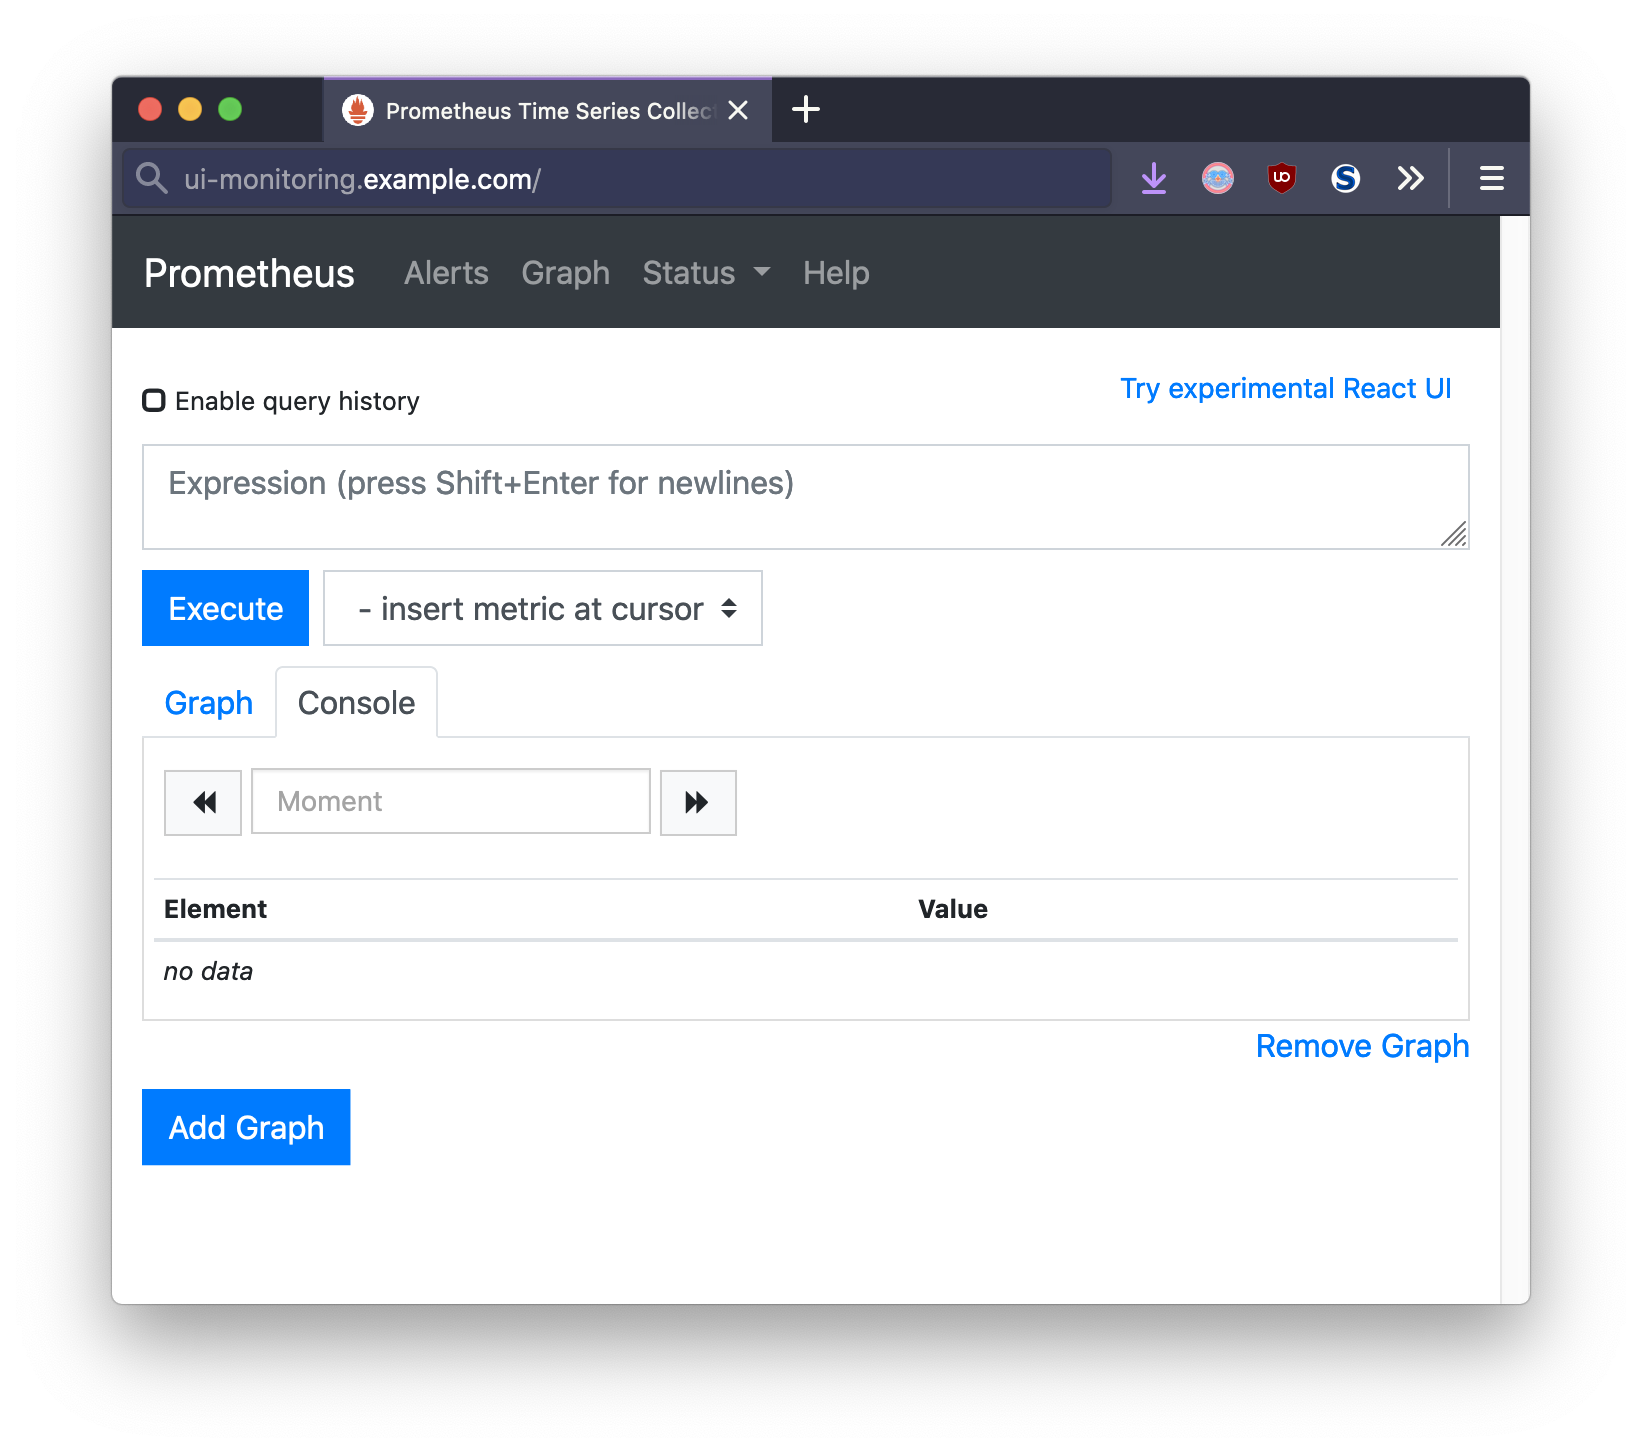
Expose Route
kube-prometheus is installed by
simply applying the manifest to the existing Kubernetes cluster. In order to
access the Prometheus, Alert-manager, and Grafana UIs, their Service will need
to be exposed. Depending on the security-model and end-users, they can be
exposed publicly via DNS, or temporarily using kubectl port-forward . This
example uses Contour ingress, and
therefore the following objects can be created:
apiVersion: projectcontour.io/v1
kind: HTTPProxy
metadata:
  annotations:
  name: ui
  namespace: monitoring
spec:
  routes:
    - conditions:
        - prefix: /
      enableWebsockets: true
      loadBalancerPolicy:
        strategy: Cookie
      services:
        - name: prometheus-k8s
          port: 9090
  virtualhost:
    fqdn: ui-monitoring.example.com
---
apiVersion: projectcontour.io/v1
kind: HTTPProxy
metadata:
  annotations:
  name: grafana
  namespace: monitoring
spec:
  routes:
    - conditions:
        - prefix: /
      enableWebsockets: true
      loadBalancerPolicy:
        strategy: Cookie
      services:
        - name: grafana
          port: 3000
  virtualhost:
    fqdn: grafana-monitoring.example.com
---
apiVersion: projectcontour.io/v1
kind: HTTPProxy
metadata:
  annotations:
  name: alertmanager
  namespace: monitoring
spec:
  routes:
    - conditions:
        - prefix: /
      enableWebsockets: true
      loadBalancerPolicy:
        strategy: Cookie
      services:
        - name: alertmanager-main
          port: 9093
  virtualhost:
    fqdn: alertmanager-monitoring.example.com
Prometheus Scrape Configs
Out of the box, kube-prometheus ships with a set of default Prometheus
rules
configured to scrape kube-state-metrics. The Prometheus operator does this by
generating a ConfigMap containing the Prometheus configuration. In order to add
additional scrape configuration, you can create an additional ConfigMap and
specify it in the Prometheus CRD. Please see Additional Scrape
Configuration
for the specific steps.
Grafana Data Sources & Dashboards
kube-prometheus also ships with a default datastore for Prometheus already set
up with the parameters needed to ingest time-series data.
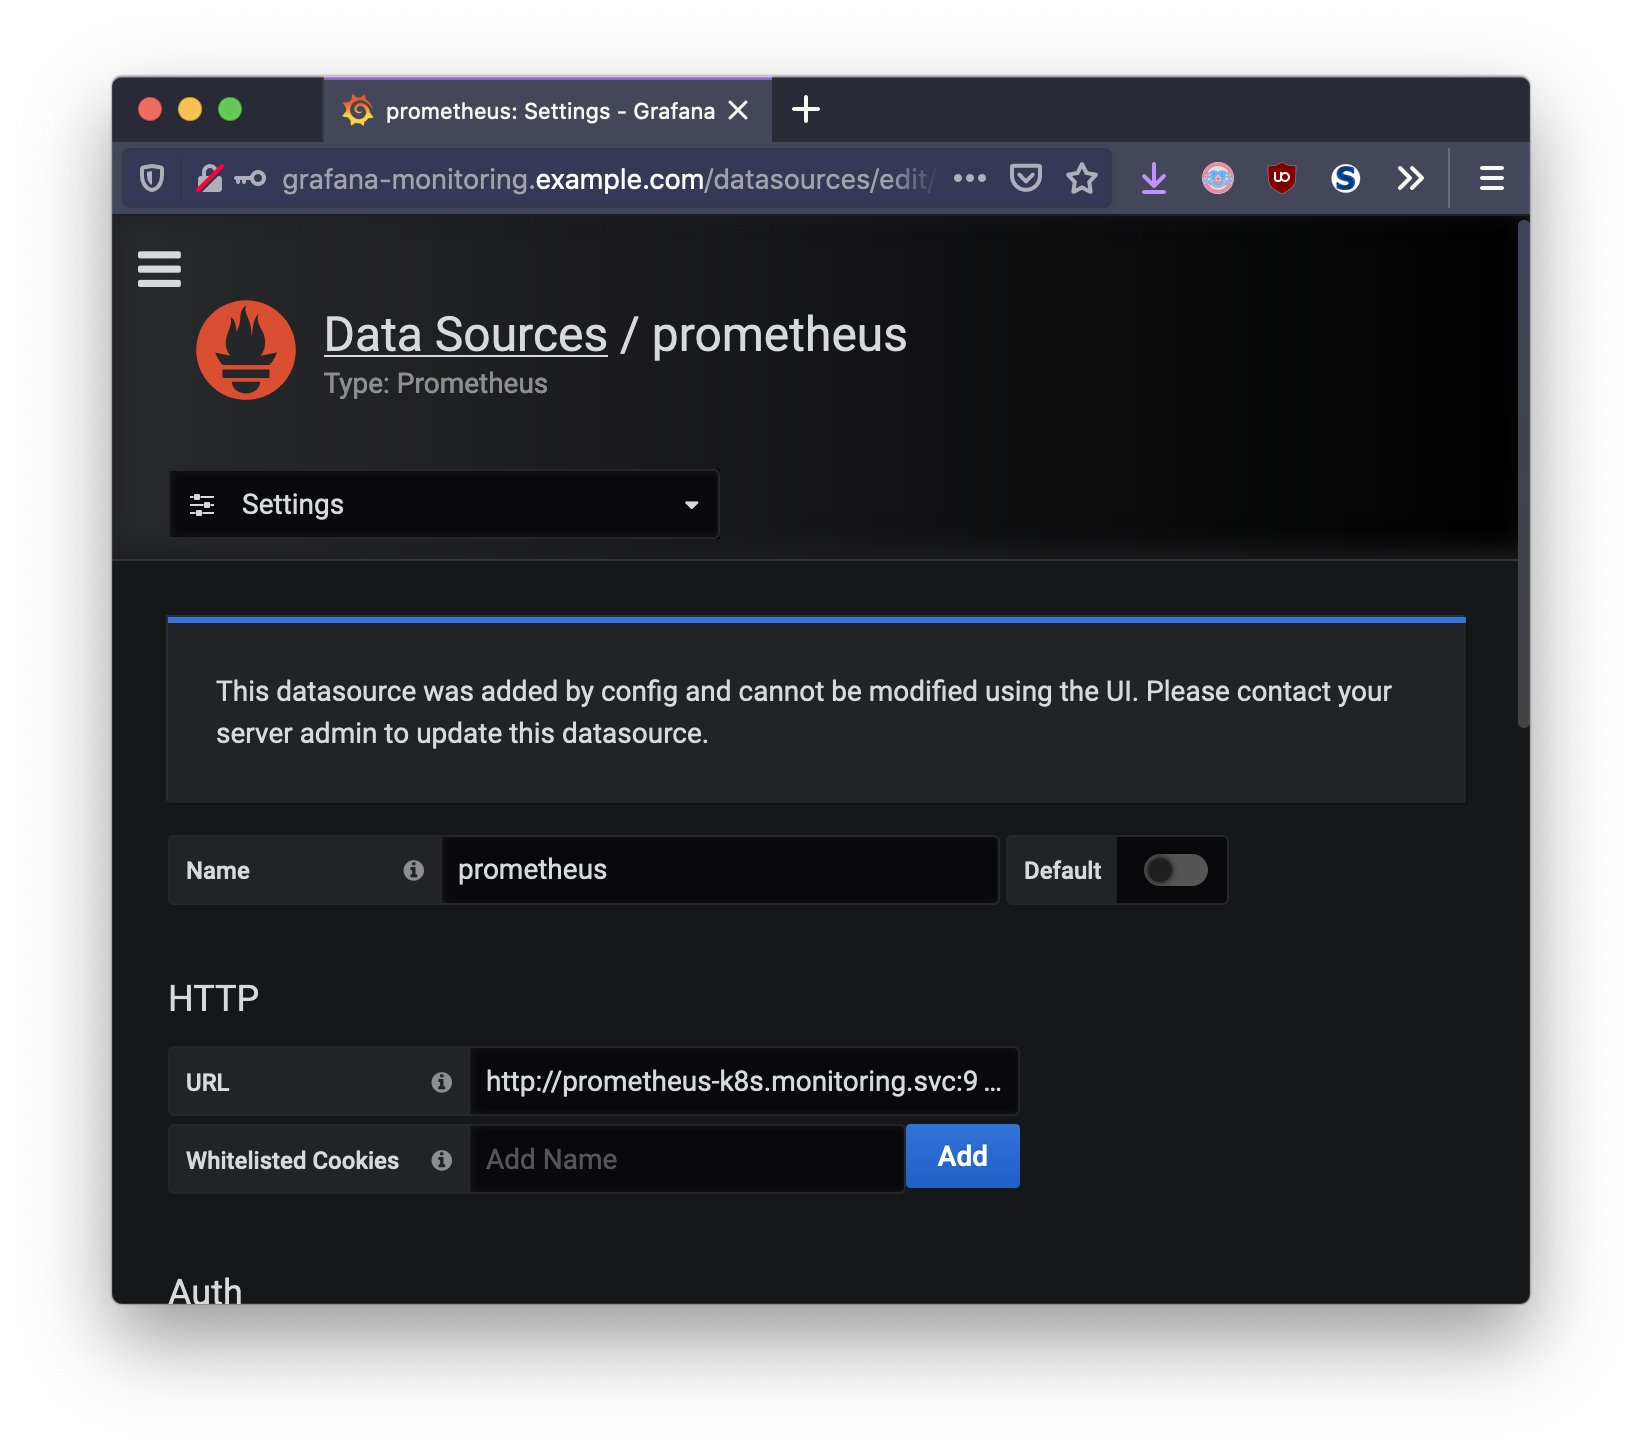
kube-prometheus also provides a set of default Grafana
Dashboards that provide a number of windows into viewing
this data.
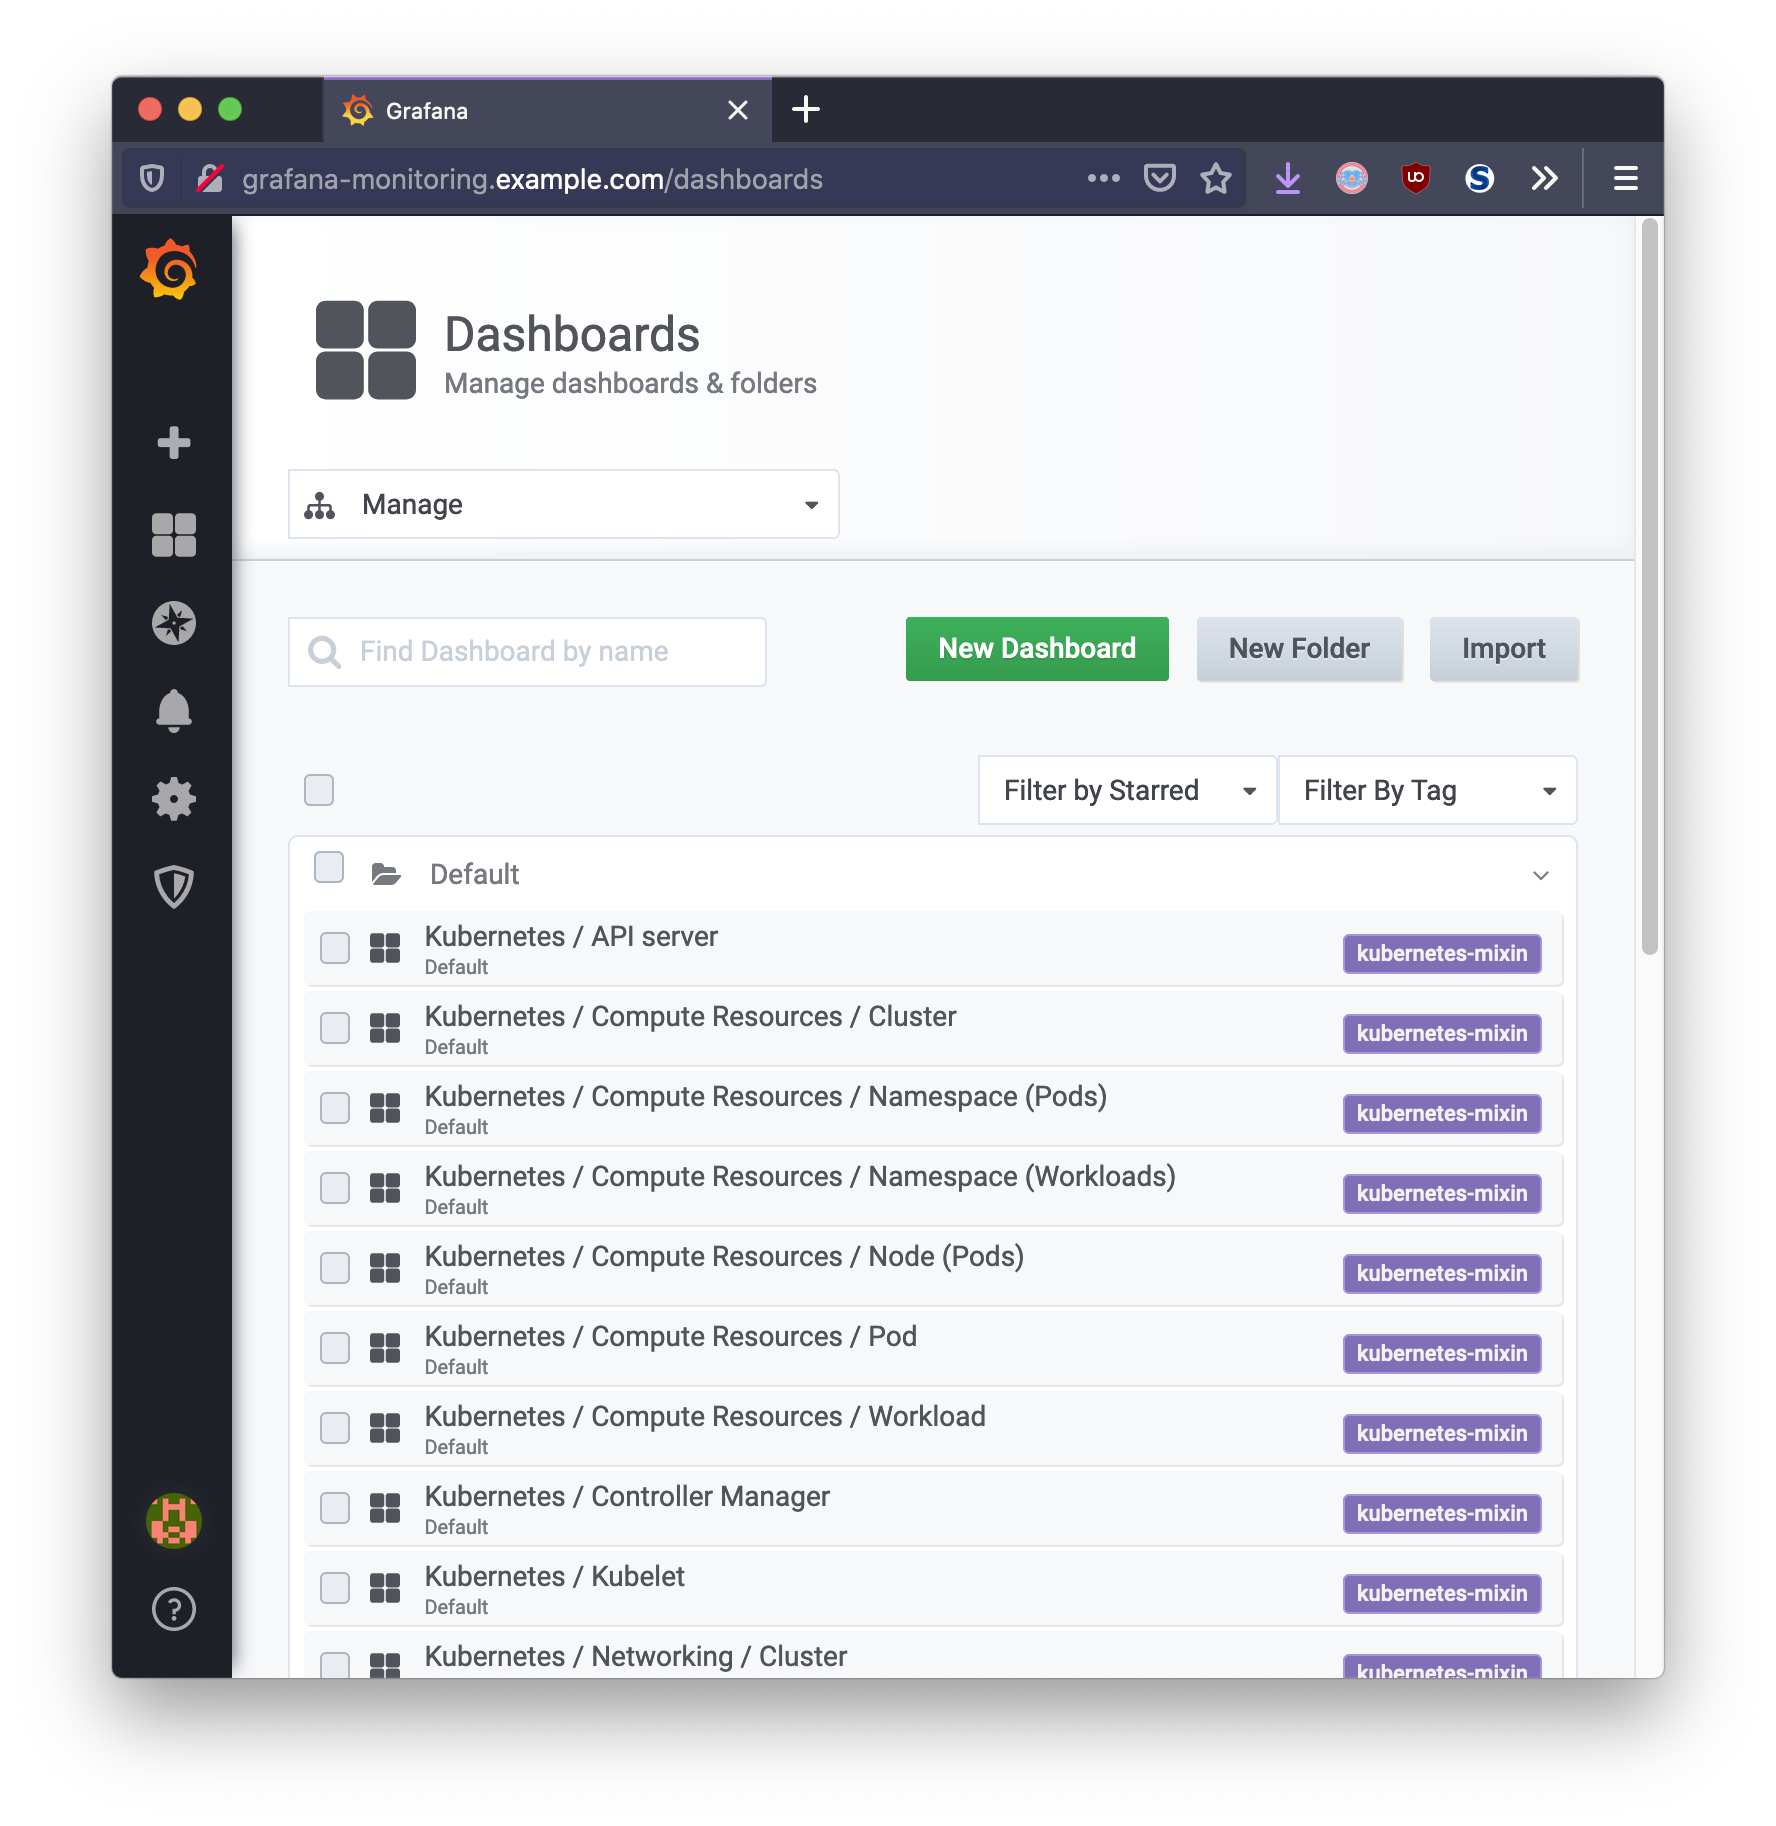
It is possible that a custom dashboard is required, for example, visualizing metrics from a custom application. This can manually be added in via the Grafana UI, or through additional configuration specified in ConfigMap resources attached to the Grafana Deployment object.
Alert Manager
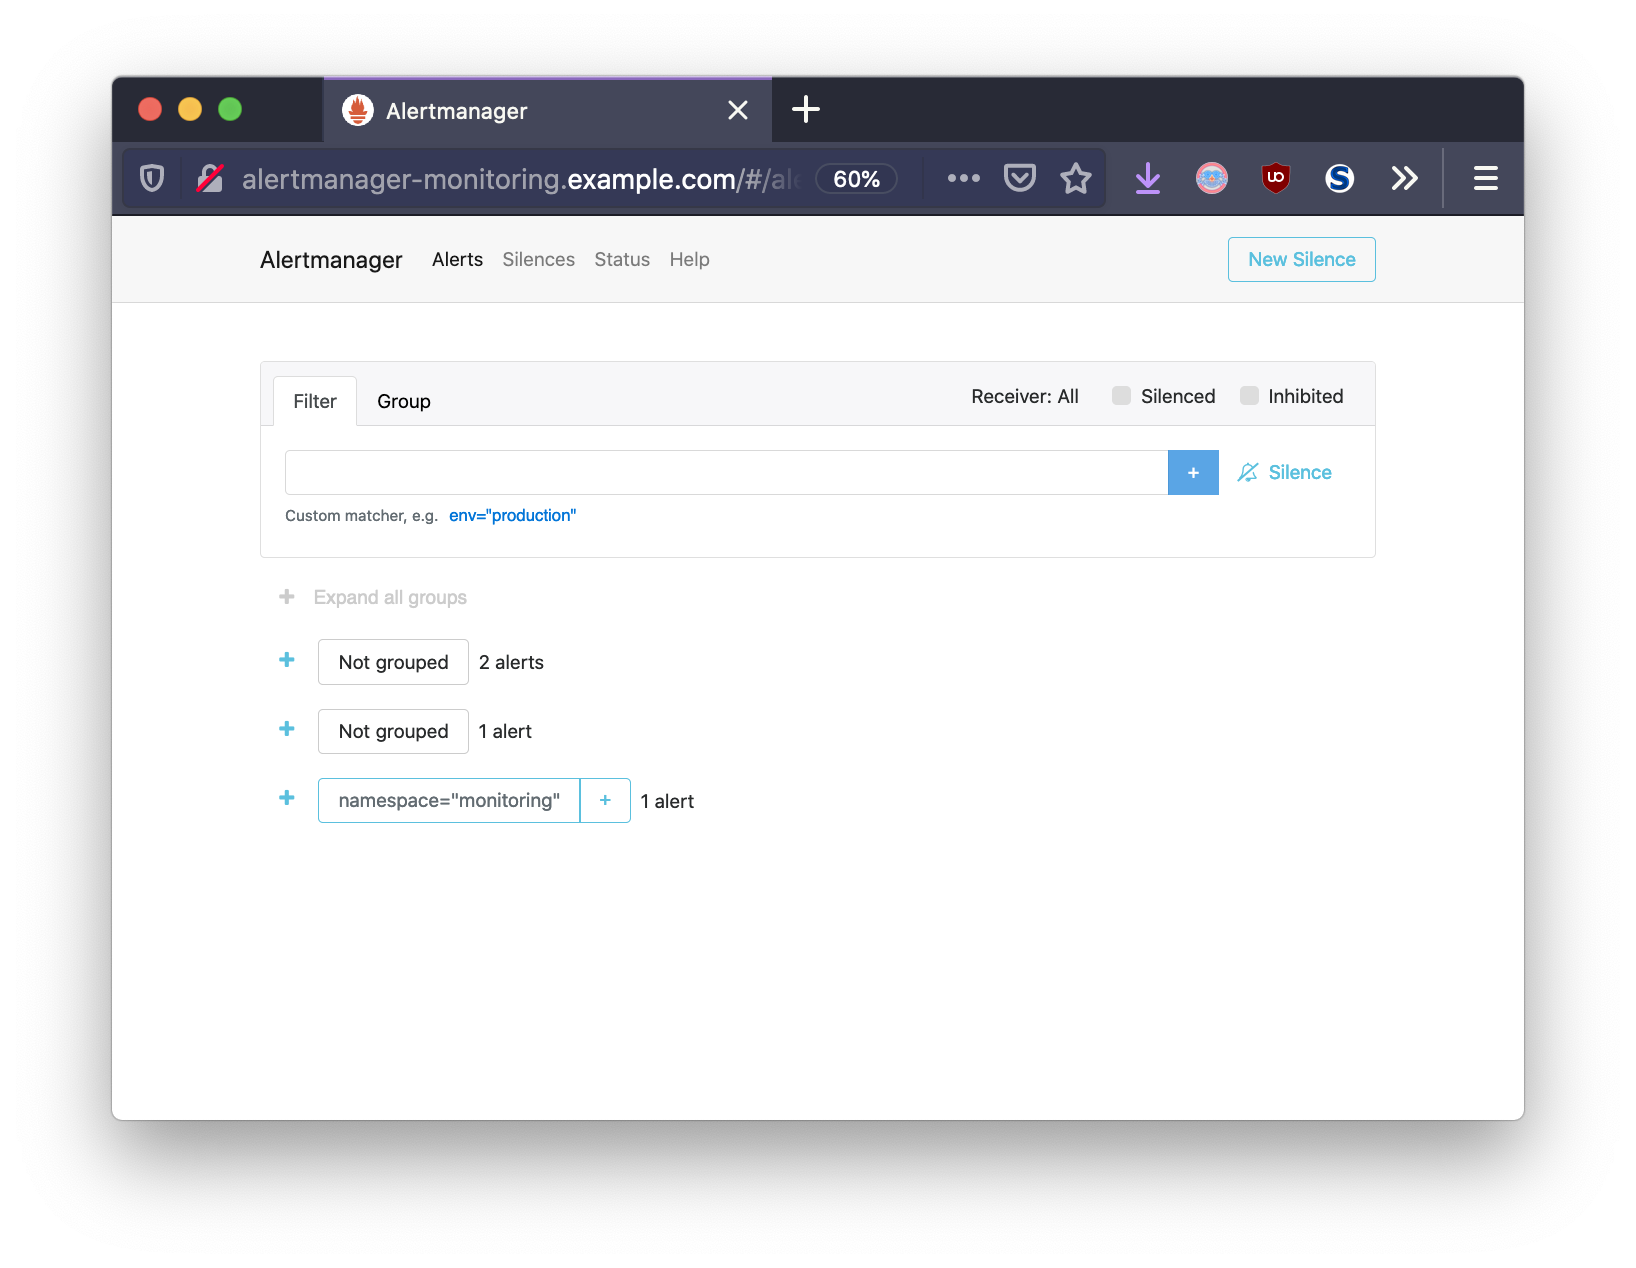
Alert Manager is provided with a default set of rules and a watchdog input. A “watchdog” refers to a Dead Man’s switch. The alert is always firing from Prometheus, and therefore should fire in Alert Manager. If it ever ceases to fire, then it is possible to detect failure in the alerting system.
This configuration is defined in a Secret from the file
alertmanager-secret.yaml and may be modified after deploying kube-prometheus
by modifying the secret and redeploying the Alert Manager StatefulSet.
kubectl get secret alertmanager-main -n monitoring --template '{{ index .data "alertmanager.yaml" }}' | base64 -d
"global":
  "resolve_timeout": "5m"
"inhibit_rules":
  - "equal":
      - "namespace"
      - "alertname"
    "source_match":
      "severity": "critical"
    "target_match_re":
      "severity": "warning|info"
  - "equal":
      - "namespace"
      - "alertname"
    "source_match":
      "severity": "warning"
    "target_match_re":
      "severity": "info"
"receivers":
  - "name": "Default"
  - "name": "Watchdog"
  - "name": "Critical"
"route":
  "group_by":
    - "namespace"
  "group_interval": "5m"
  "group_wait": "30s"
  "receiver": "Default"
  "repeat_interval": "12h"
  "routes":
    - "match":
        "alertname": "Watchdog"
      "receiver": "Watchdog"
    - "match":
        "severity": "critical"
      "receiver": "Critical"
Downstream services that receive alerts will need to be specified in the
receivers section. Alert Manager provides many capabilities to alert with
external systems like email, Slack, Wechat, etc. For example, in order to add
WeChat functionality to the Critical receiver, you would add a wechat_config
field to your receiver titled Critical.
It is important to lock down Alertmanager from unauthorized access. This can be done by removing the Ingress or securing the route using TLS certificates. As stated in the documentation: “Any user with access to the Alertmanager HTTP endpoint has access to its data. They can create and resolve alerts. They can create, modify and delete silences.”
Monitoring Cluster
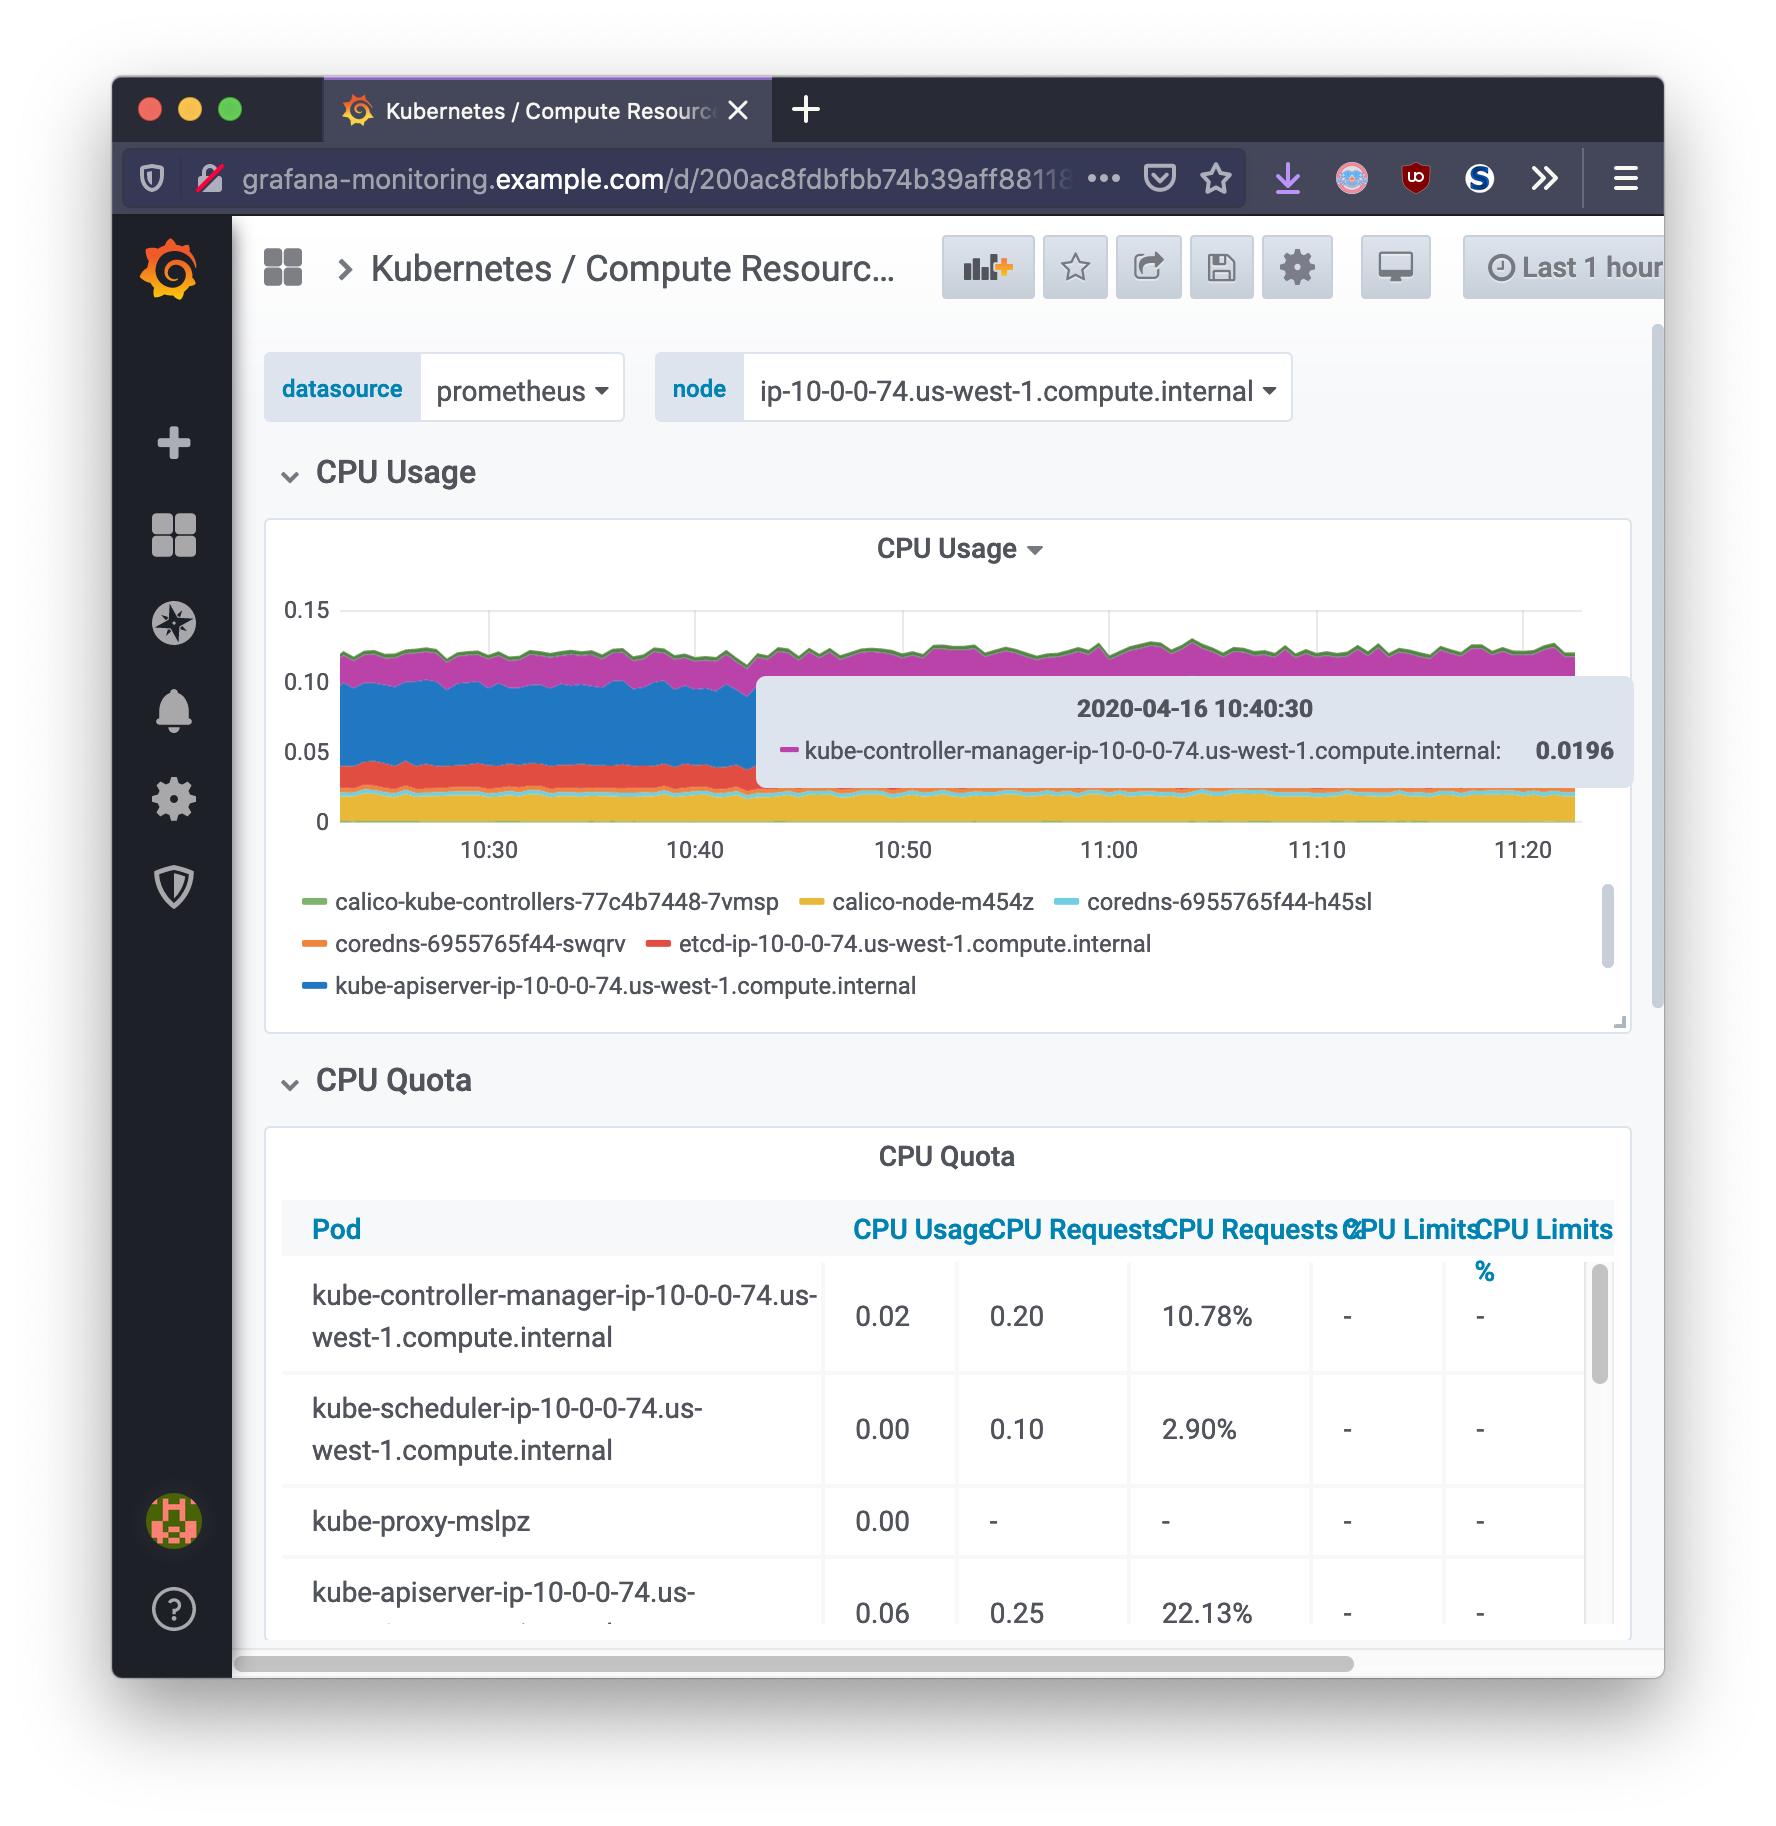
Grafana provides the cluster administrator with a single pane of glass view into the Kubernetes cluster operations. Using dashboards, Grafana can present the monitoring data with respect to time in a way that is meaningful for measuring the health of infrastructure, workloads, and network related data.
Ingesting Custom Application Metrics
When developing an application, Prometheus will by default expect metrics to be
accessible via /metrics. This can also be configured. This is specified
through the ServiceMonitor resource, which monitors Service resources for your
particular application and updates Prometheus with the necessary corresponding
scrape configuration. This allows Prometheus to ingest these metrics like it
would normally expect from a Prometheus config file.
kind: ServiceMonitor
apiVersion: monitoring.coreos.com/v1
metadata:
  name: sample-app
  labels:
    app: sample-app
spec:
  selector:
    matchLabels:
      app: sample-app
  endpoints:
    - port: http
      interval: 5s
The above resource will monitor a Service sample-app and the Prometheus
operator will add the necessary scrape configuration. This will allow the
metrics to be recorded by Prometheus.
Scaling Applications in Response to Monitoring
Now that this custom application is recording metrics in Prometheus, what if you wanted Kubernetes to respond to changes in a specific metric and scale the application? Kubernetes provides a Custom Metrics API which can be leveraged to automatically scale application deployments in real-time. This is highly flexible and also evolving.

The Custom Metrics API is a framework for exposing arbitrary metrics as
Kubernetes API metrics. It allows them to appear via
/apis/custom.metrics.k8s.io/ and be fetched internally by
HorizontalPodAutoscalers.
While Horizontal Pod Autoscalers ship with built-in CPU and memory
resource-based scaling, it is sometimes necessary to utilize custom
application-supplied metrics to scale the application. This is necessary for
scaling beyond the built-in CPU and memory metrics. The example below is based
on the in-depth
guide
provided with k8s-prometheus-adapter.
Currently scaling on memory and custom metrics are
only supported by HorizontalPodAutoscaler autoscaling/v2beta2 API version.
The following is an example HorizontalPodAutoScaler that watches the
http_requests metric of the sample-app Deployment:
kind: HorizontalPodAutoscaler
apiVersion: autoscaling/v2beta2
metadata:
  name: sample-app
spec:
  scaleTargetRef:
    apiVersion: apps/v1
    kind: Deployment
    name: sample-app
  minReplicas: 1
  maxReplicas: 10
  metrics:
    - type: Pods
      pods:
        metric:
          name: http_requests
        target:
          type: AverageValue
          averageValue: 500m
Behind the scenes, the HPA controller detects the presence of this object, and determines the custom metrics required.
The metrics endpoint is specified by an APIService resource:
apiVersion: apiregistration.k8s.io/v1beta1
kind: APIService
metadata:
  name: v1beta1.custom.metrics.k8s.io
spec:
  service:
    name: prometheus-adapter
    namespace: monitoring
  group: custom.metrics.k8s.io
  version: v1beta1
  insecureSkipTLSVerify: true
  groupPriorityMinimum: 100
  versionPriority: 100
The above resource is what ties the custom API endpoint to the Kubernetes Prometheus Adapter. The adapter runs as a sort-of translation layer between Kubernetes API requests, and the Prometheus server.
Therefore, if an application sample-app is deployed and configured with a HPA
resource, this application can be scaled horizontally as http_requests
increases.
$ kubectl describe hpa.v2beta2.autoscaling sample-app
Name:                       sample-app
Namespace:                  default
Labels:                     <none>
Annotations:                <none>
CreationTimestamp:          Fri, 17 Apr 2020 13:30:15 -0500
Reference:                  Deployment/sample-app
Metrics:                    ( current / target )
  "http_requests" on pods:  386m / 500m
Min replicas:               1
Max replicas:               10
Deployment pods:            4 current / 4 desired
Conditions:
  Type            Status  Reason              Message
  ----            ------  ------              -------
  AbleToScale     True    ReadyForNewScale    recommended size matches current size
  ScalingActive   True    ValidMetricFound    the HPA was able to successfully calculate a replica count from pods metric http_requests
Every 2.0s: kubectl get pods                archlinux: Fri Apr 17 15:18:43 2020

NAME                          READY   STATUS    RESTARTS   AGE
sample-app-579bc6774c-cdpd2   1/1     Running   0          103m
sample-app-579bc6774c-dv865   1/1     Running   0          103m
sample-app-579bc6774c-lbm5k   1/1     Running   0          21h
sample-app-579bc6774c-zp482   1/1     Running   0          103m