Application Enhancements
John Harris
Kubernetes does not demand specifics about the applications that run on top of it. They don’t not need to be microservices, 12 factor, or maintain other specific software philosophies. However, for an application to run well on Kubernetes, there are aspects of your application you may wish to reconsider.
Kubernetes is a distributed system that has behaviors different from what many are used to in a traditional environment. These include:
- Workloads must be packaged in a container.
- Workloads may be moved (stopped and recreated) based on the needs of the system.
- Workload IP addresses are [generally] ephemeral.
- Workloads have no affinity to hosts.
Aside from the above constraints, how your application is developed and run is up to you. There are multiple considerations you can make to comply with more idiomatic Kubernetes software practices. The following checklist covers the considerations for running an application in Kubernetes.
Popular Tooling & Approaches
Application Probes
Kubernetes supports a multitude of probes that indicate state of a running workload. For details on implementing probes, see the guide on Probing Application State.
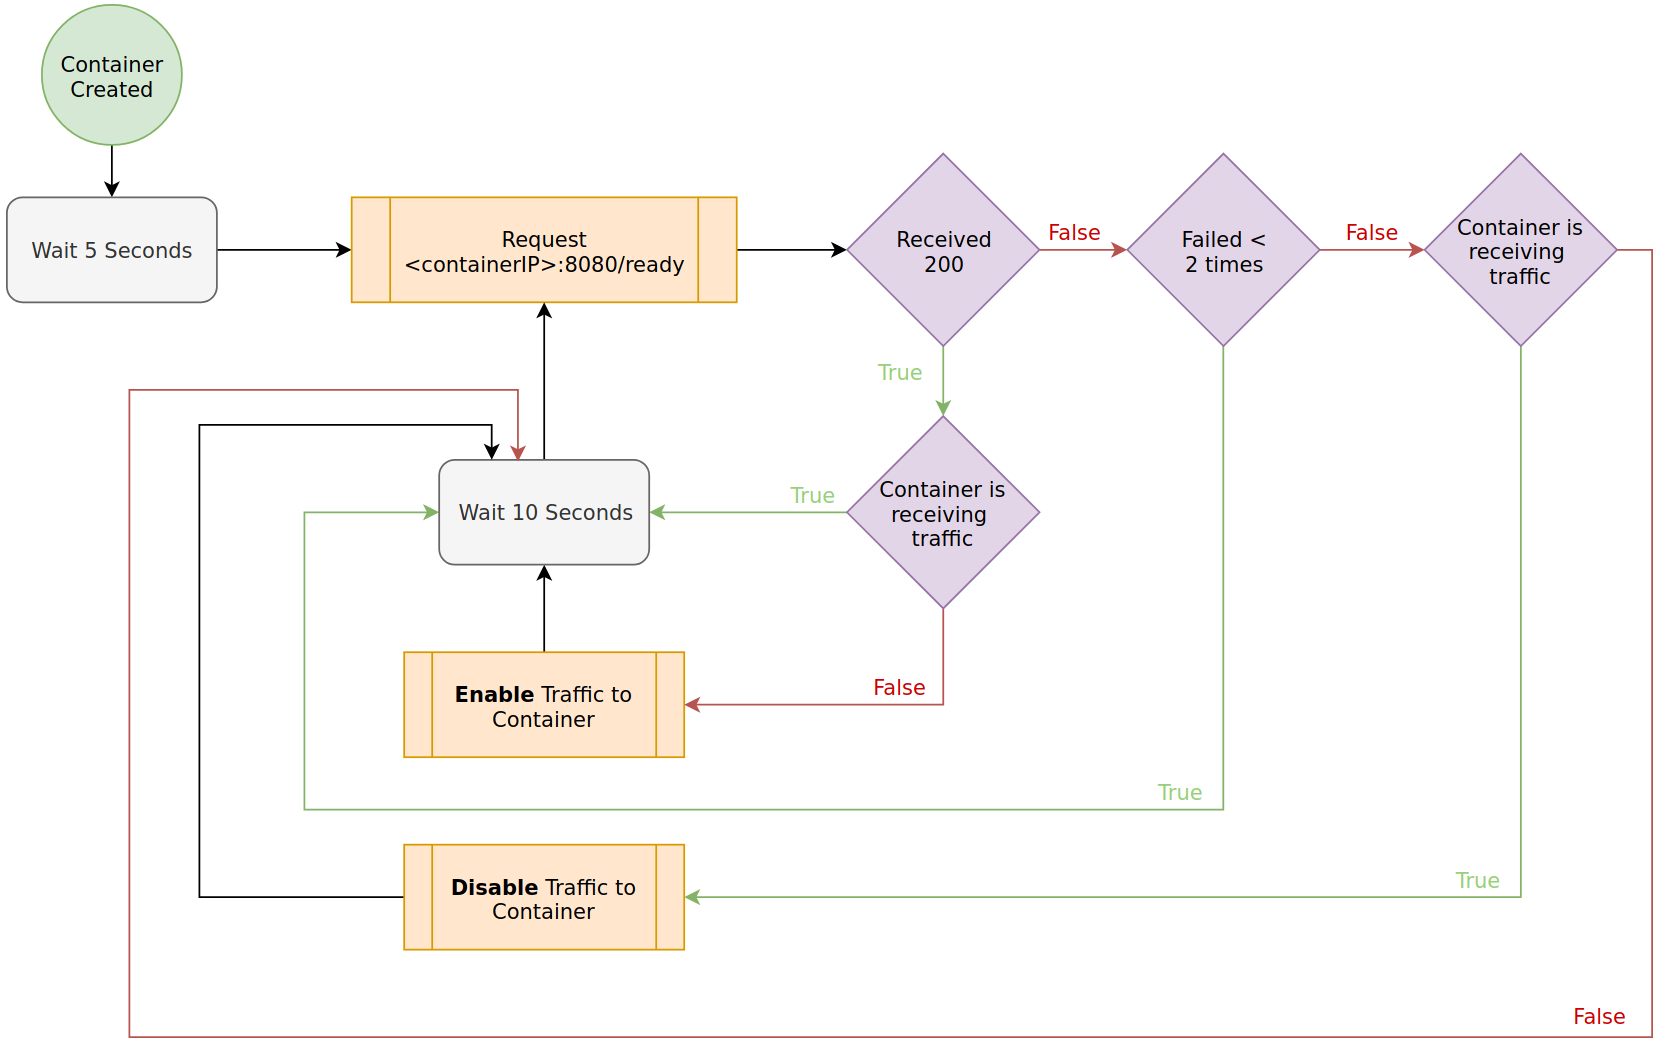
Readiness Probe
You should use readiness probes as they gate whether your application is considered ‘Ready’ to a cluster. Until applications are ‘Ready’ they do not receive traffic. A simple HTTP check that reports ready, post initialization is often adequate.
For implementation details, see the guide on Probing Application State.
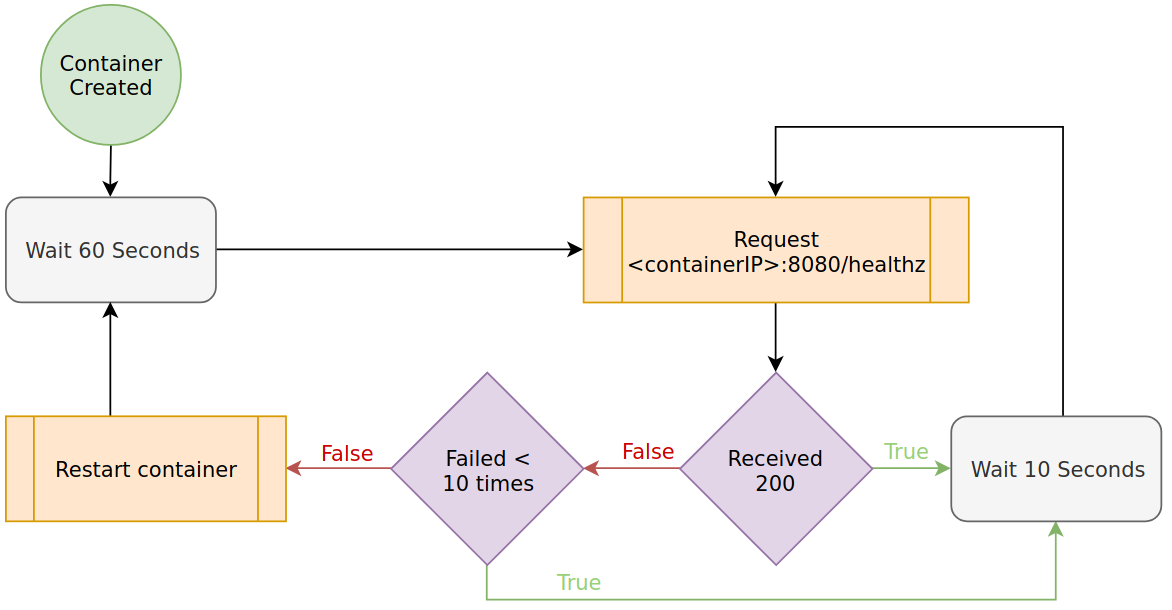
Liveness Probe
You should consider liveness probes as a ‘safety’ check for your application to ensure it hasn’t halted operation unexpectedly. These checks should not rely on external dependencies as you don’t want your application to restart due to external issues.
For implementation details, see the guide on Probing Application State.
Startup Probe
You should consider a startup probe for legacy applications that require a larger amount of time for their initial startup. This probe only executes on first start-up and does not continue probing over time (like readiness and liveness). After a startup probe succeeds, if configured, a liveness probe will continue. Ideally, modern applications do not require this kind of protection, but it can be helpful when long start ups cannot be worked around.
Externalized Configuration
In Kubernetes based-platform, you should keep all application configuration outside of the application / container when possible. This will enable you to dynamically change how your application runs by altering ConfigMaps and Secrets. It’s also helpful when deploying the application into different context or environments.
For details on how to externalize configuration, see the externalizing configuration guide.
Graceful Shutdown Mechanics Handlers
As Kubernetes moves workloads around the cluster, an instance of your application can be asked to stop so a new instance of it can be started elsewhere. If your application requires any amount of graceful shutdown, you should ensure your application can handle this event.
When a pod is being deleted, moved, or recreated each container’s PID 1 receives a SIGTERM. The process then has a grace-period to do what it needs and exit. The default grace-period is 30 seconds; check with your cluster administrator to understand what your cluster is set to. If the grace period expires, a SIGKILL is sent. For more details, see the Termination of Pods documentation.
If a process, script, or HTTP endpoints must be called to terminate gracefully, you can also add a preStop hook to your Kubernetes manifest.
For details on how to gracefully shutdown pods, see the graceful shutdown guide.
Structured Logging
Structured logging allows log aggregation systems to provide a better view of your applications logs. You should consider this approach for applications running Kubernetes. Typically it’s as simple as creating log-helper functions or introducing a logging library. For implementation details, see the logging practice guide.
Export Application Metrics
When exposing metrics about your application, it is a common practice to use an exporter. This allows you to introduce metrics to your application and a scraping system, such as prometheus, to gather those metrics over time. There are exporter libraries for most languages. See the Client Library documentation for a list of examples.
Work with your platform team to determine if scrape-based monitoring system such as prometheus, Datadog, or Elastic is available.
For more details, see the Exporting Application Metrics guide
Trace Points
In service based architectures, a request can move through many applications and thus across network boundaries multiple times. A trade-off to these architectures is detecting where issues in the stack are occurring. For example, where is most of the latency in a request coming from?
If your workload falls into this architecture, implementing tracing in your application(s) is worth considering. Often you need a system that lets you view trace results, before running one, you may wish to check with your platform team to see if something pre-exists.
For more details on this concern, see the Observability section.