Getting Started with Wavefront for Spring Boot
Brian McClain
VMware Tanzu Observability by Wavefront offers a free tier for Spring Boot developers. If you’re unfamiliar with Wavefront, it provides a SaaS-based platform for real-time metrics, monitoring, and alerting. It has integrations for many languages, frameworks, and platforms. Simply put, you send Wavefront your metrics, and it handles visualization and analysis. Additionally, Wavefront for Spring Boot helps Spring developers to integrate with Wavefront while still using solutions they’re used to, such as Micrometer and Sleuth.
In this guide, you’ll take an existing application and add Wavefront for Spring Boot, which will start sending metrics and traces to Wavefront. Additionally, you’ll see how custom metrics added via Micrometer are reflected in Wavefront.
Before You Begin
Before you get started, you will need the following tools:
- Your text editor or IDE of choice
- JDK 1.8 or newer
- Gradle 4+ or Maven 3.2+
If you want to see the whole demo put together, you can find the complete code on GitHub. This guide will also link to specific commits if you want to see the code changes done along the way, but if you want the short version, make sure to check out these commits:
These commits will also be denoted along the way.
Modifying an Existing Application
Commit: 3e99b9e
For this demo, you’ll be modifying an existing application, the Spring Pet Clinic. This will provide a starting point of a fully working application so that you can focus on the topic of this guide. Clone this code and cd into the newly created directory:
git clone https://github.com/spring-projects/spring-petclinic.git
cd spring-petclinic
If you’re curious how this application works, feel free to build and run it. You can start the application as a standard Spring application:
./mvnw spring-boot:run
After a few moments, the application will be up and running, available at http://localhost:8080. Poke around, check it out, and when you’re done, stop the application.
To get started with Wavefront for Spring Boot in the most basic form, there are actually no code changes required. You may be familiar with Micrometer, which not only provides basic metrics for Spring applications by default but also offers an interface for providing custom metrics. The Wavefront Spring Boot starter takes this Micrometer data and ships it to Wavefront automatically, allowing you to continue to instrument your code the way you’re used to doing. There’s one other dependency that you can include, which is Sleuth. Much like Micrometer, Sleuth can provide some automated instrumentation for your code, but in this case it will enable tracing requests in your application. That means you can follow requests all the way through your code to find problem spots.
Add these two dependencies to your pom.xml file:
<dependency>
    <groupId>com.wavefront</groupId>
    <artifactId>wavefront-spring-boot-starter</artifactId>
    <version>2.1.0</version>
</dependency>
<dependency>
    <groupId>org.springframework.cloud</groupId>
    <artifactId>spring-cloud-starter-sleuth</artifactId>
    <version>3.0.0</version>
</dependency>
There’s just one other thing you’ll need to do, which is to tell Wavefront a bit about your application. Luckily, this can be done in just a couple of configuration values in your src/main/resources/application.properties file:
wavefront.application.name=spring-petclinic
wavefront.application.service=spring-petclinic-app
It’s not uncommon that applications are made up of multiple backend services. Consider if the Pet Clinic application had a pet service, a vet service, and so on. For this reason, the Wavefront configuration distinguishes between wavefront.application.name, or the name of the overall application, and wavefront.application.service, or the name of this specific service.
Exploring Wavefront
With the changes to your pom.xml file and your application.properties file, you’re ready to start the application back up and see your metrics begin to appear in Wavefront. Again, you can start the app as a standard Spring application:
./mvnw spring-boot:run
You’ll notice some new information in the log output. Specifically, once the application is running, keep an eye out for a line that reads:
Connect to your Wavefront dashboard using this one-time use link:
https://wavefront.surf/us/xxxxxxxxxx
Open this link in your browser, and you’ll be greeted with your Wavefront dashboard! But things are looking a little empty. Without any traffic to your application, there’s not a whole lot to look at here, so open up your Pet Clinic application at http://localhost:8080 and start poking around. Refresh a few different pages a few times; try adding pets to owners. Click the “Error” page a few times.
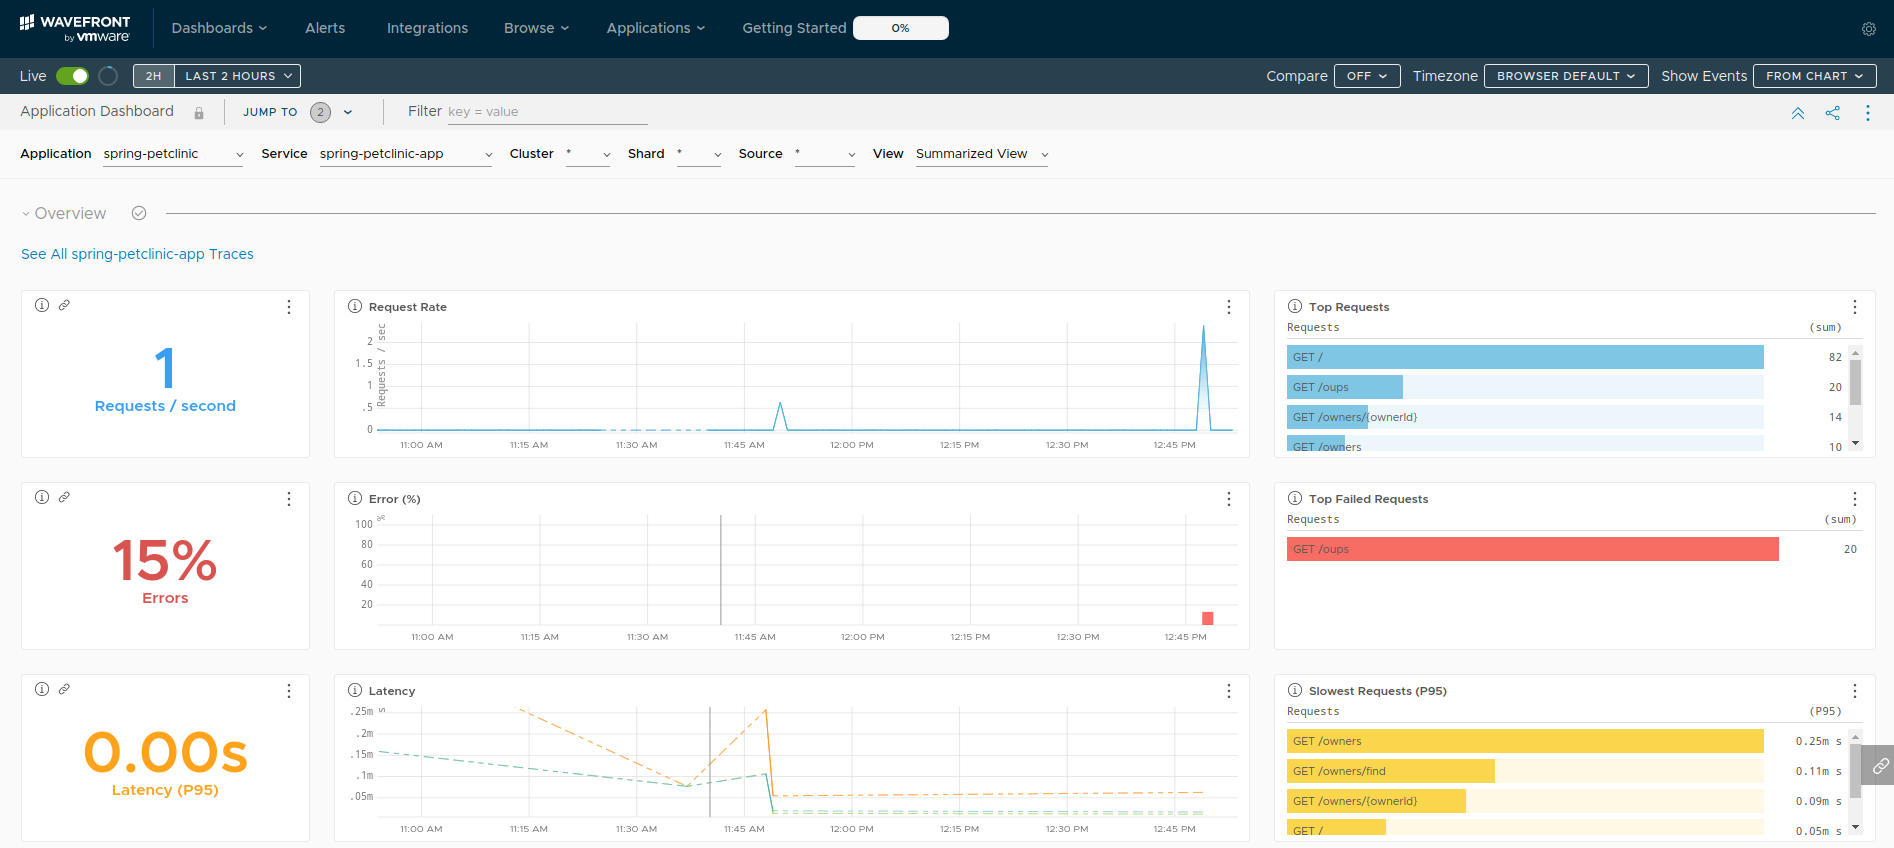
You can see from the image above that GET / got the most requests, GET /owners is the slowest to respond on average, and that 15 percent of requests resulted in an error, with all of those errors being raised from GET /oups. This already gives you a few places to start investigating issues that your application could be having.
Adding Your Own Metrics
Commit: b9a60f7
The above changes feed in both the standard metrics from Micrometer and traces from Sleuth into Wavefront, but there are probably some metrics specific to your application as well. Let’s consider a scenario where you’d like to keep track of pet owners who are looked up on the application the most often. Luckily, this is as easy as adding a new counter through Micrometer:
Metrics.counter("owner.lookup", "name", owner.getLastName() + ", " + owner.getFirstName()).increment();
In the above example, a new metric named owner.lookup is created, with one key/value pair: a key of name with a value containing the owner’s name, in the format of “Last Name, First Name”. When added to the showOwner method that’s annotated with @GetMapping("/owners/{ownerId}") in the OwnerController.java file, each request will increment a counter for the owner that they look up. Again, restart the application and send some traffic to some user pages.
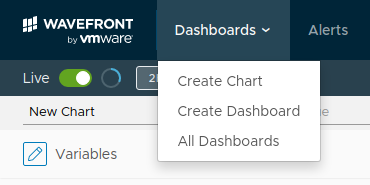
This data can be visualized in Wavefront by clicking “Dashboard”, then “Create Chart”
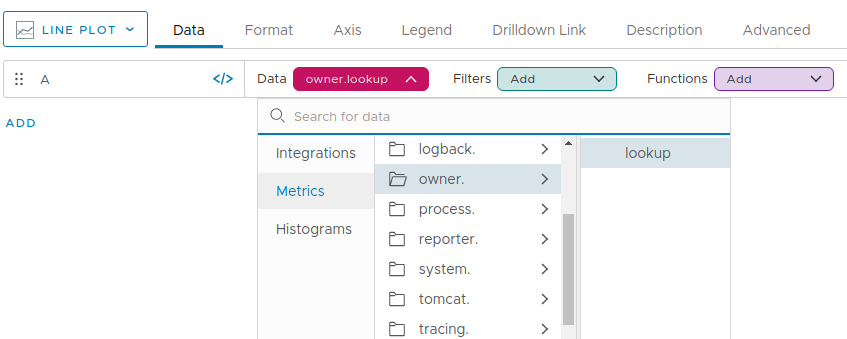
From here, the newly gathered data can be added to the chart by selecting it as the data to show:
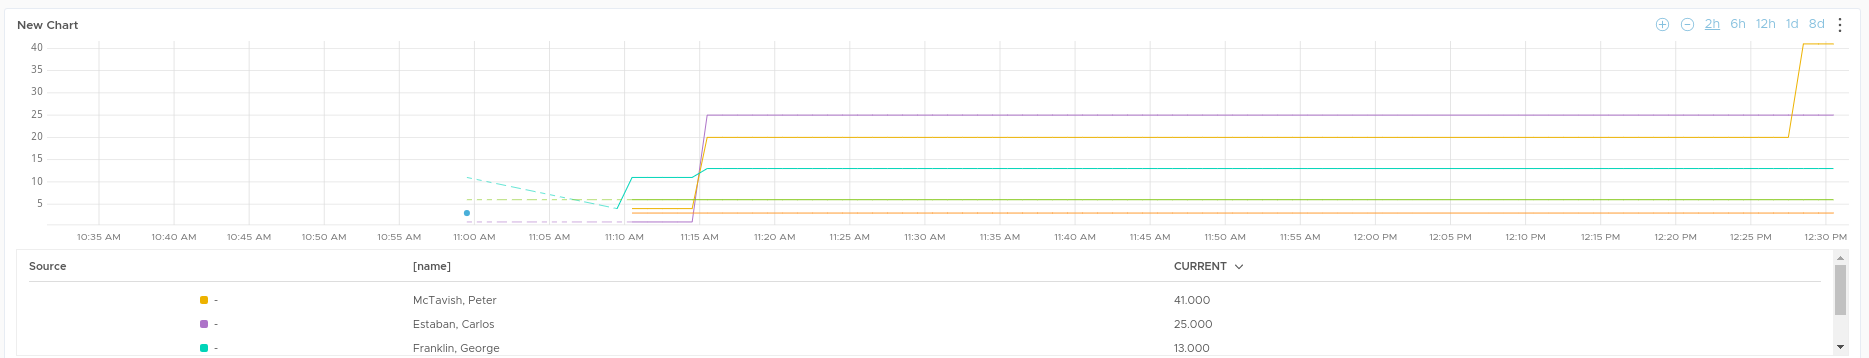
You’ll then see all of the requests to all of the owners that you sent traffic to:
Keep Learning
You can find much more information in the Wavefront documentation. If you’re looking to learn more about Micrometer and how you can instrument your Spring applications, make sure to check out the Micrometer concepts and the different types of tools provided there in order to get better insight into your code.